Figures & data
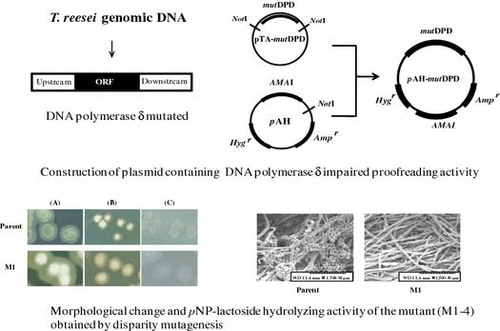
Fig. 1. Scheme for the construction of pAH and pAH-mutDPD.
Notes: pAH has a pBluescript II backbone into which AMAI, a replication origin in A. nidulans, and Hygr, a hygromycin resistant gene in fungi, were inserted. pAH-mDPD was constructed by the insertion of mutDPD, DNA polymerase δ lacking proofreading activity, into pAH.
Fig. 2. Plasmid insertion confirmed by PCR.
Notes: The introduction of pAH or pAH-mutDPD into T. reesei was verified by PCR. The partial sequence of GAPDH (internal control of genomic DNA extraction) and Hygr (marker of inserted vector) were amplified from genomic DNA of transformants as template. The partial sequence of Hygr was amplified from the DNA of purified pAH and pAH-mutDPD plasmids, and GAPDH was amplified from the genomic DNA of the parent strain.
Table 1. Mutation ratio of disparity mutagenesis evaluated by colony formation in comparison to UV-irradiation.
Fig. 3. Colony formation of glucose de-repressed mutant and parent.
Notes: The M1 mutant strain, which was arbitrarily selected from among six glucose de-repressed mutants, and the parental strain were grown on agar plates for 5 days at 30 °C. (a) potato dextrose; (b) glucose; (c) Avicel (crystalline cellulose). The scale bar in the photograph indicates 1 cm.
Fig. 4. Scanning electron microscopy of conidia and mycelia.
Notes: (a) parent; (b) M1 mutant. Magnification:1500 times. The scale bar in the photograph indicates 30 μm.
Fig. 5. Expression of cre1 analyzed by RT-PCR.
Notes: The primers and PCR conditions used are described in the “Materials and Methods”.
Fig. 6. Cellulase activity of the glucose de-repressed mutants (M1–4) and parent strain.
Notes: (a) glucose medium; (b) Avicel medium. The cellulase activity was measured as pNP-lactoside hydrolyzing activity. The data are presented as the mean ± standard deviation (error bars) obtained from three independent experiments.