1,316
Views
2
CrossRef citations to date
0
Altmetric
Analytical Chemistry

Reversed-phase liquid chromatographic analysis of hydrophobic interaction between proanthocyanidins and a C8-alkyl compound in aqueous solution

, &
Pages 419-425 | Received 18 Aug 2015, Accepted 27 Sep 2015, Published online: 16 Nov 2015

Figures & data

Fig. 1. Structures of monomeric and oligomeric flavan-3-ols used as experimental standards.

Fig. 1. Structures of monomeric and oligomeric flavan-3-ols used as experimental standards.

Fig. 2. CD, UV, and FL (emission spectra excited at 281 nm) spectra of EC (1c) and EC oligomers (2b, 3a, 4a, 5a) in water.
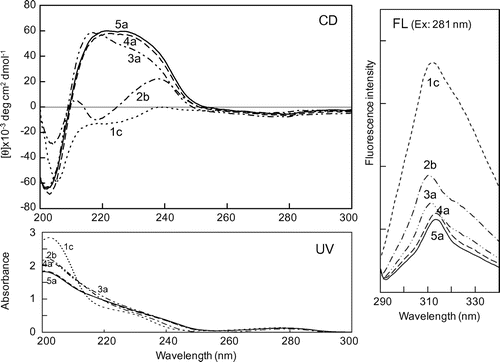
Note: The concentration of each sample was 50 μg/mL for CD and UV analyses, and 1 μg/mL for FL analysis.
Fig. 2. CD, UV, and FL (emission spectra excited at 281 nm) spectra of EC (1c) and EC oligomers (2b, 3a, 4a, 5a) in water.

Fig. 3. Merged chromatogram of eleven flavan-3-ol standards separated by RP C8-HPLC in isocratic elution mode.
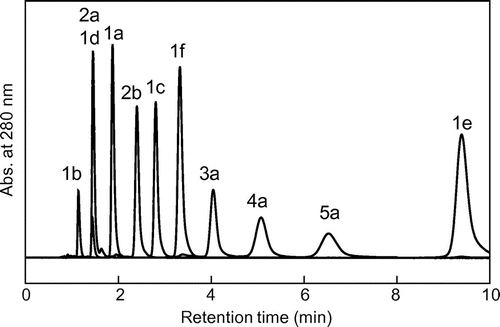
Notes: Column: Chromolith Performance RP-8e (4.6 mm I.D. × 100 mm; Merck); mobile phase: acetonitrile–aqueous 0.1% TFA (10:90, v/v); flow rate: 2.0 mL/min; detection: absorbance at 280 nm; injection volume: 10 μL; concentration of each standard: 50 μg/mL. The number of each peak corresponds to the number of each standard shown in Fig. .
Fig. 3. Merged chromatogram of eleven flavan-3-ol standards separated by RP C8-HPLC in isocratic elution mode.

Fig. 4. Relationship between log k values of eleven standards in C8-HPLC and their log Po/w values.
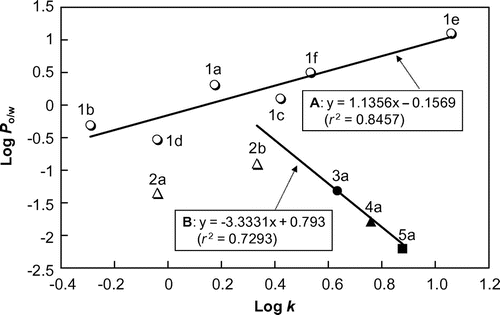
Notes: The inset regression equation (A) was obtained from six monomeric flavan-3-ols (1a–1f). The regression equation (B) was for EC (1c) with respect to four EC oligomers (2b, 3a, 4a, 5a) linked with (4β→8) bond
Fig. 4. Relationship between log k values of eleven standards in C8-HPLC and their log Po/w values.

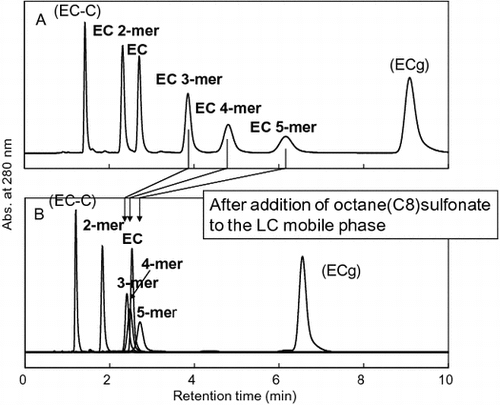
Fig. 5. Comparison of C8-HPLC profiles of EC oligomers and related flavan-3-ol standards in different mobile phases.
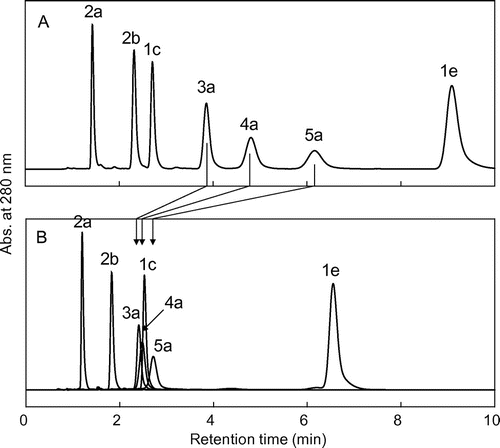
Notes: A: acetonitrile–aqueous 0.1% TFA (10:90, v/v); B: solvent A containing 10 mM OSA·Na. Other chromatographic conditions were identical to those described in Fig. caption.
Fig. 5. Comparison of C8-HPLC profiles of EC oligomers and related flavan-3-ol standards in different mobile phases.
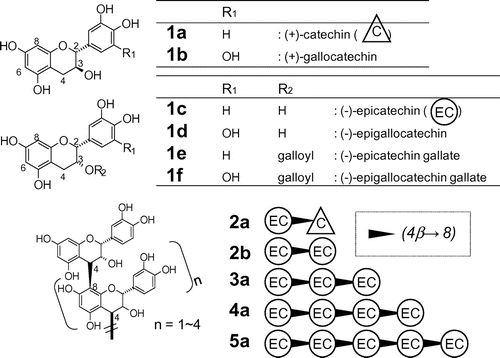
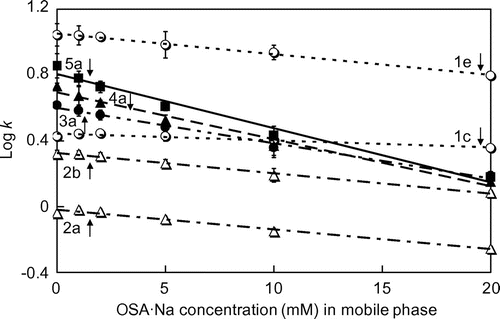
Fig. 6. Relationship between the concentration of OSA·Na added to mobile phase (solvent A) and log k values of seven standards in C8-HPLC in each mobile phase.

Fig. 6. Relationship between the concentration of OSA·Na added to mobile phase (solvent A) and log k values of seven standards in C8-HPLC in each mobile phase.

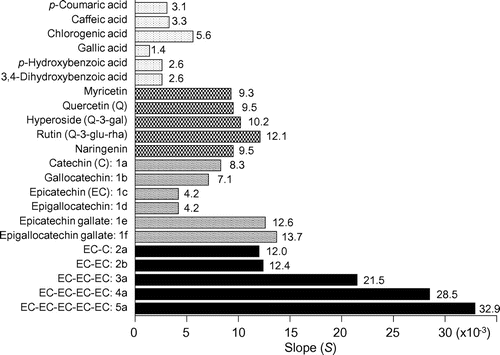
Fig. 7. Comparison of S values of twenty-two polyphenolic standards.

Fig. 7. Comparison of S values of twenty-two polyphenolic standards.

Reprints and Corporate Permissions

Please note: Selecting permissions does not provide access to the full text of the article, please see our help page How do I view content?

To request a reprint or corporate permissions for this article, please click on the relevant link below:

Academic Permissions

Please note: Selecting permissions does not provide access to the full text of the article, please see our help page How do I view content?

Obtain permissions instantly via Rightslink by clicking on the button below:

If you are unable to obtain permissions via Rightslink, please complete and submit this Permissions form. For more information, please visit our Permissions help page.