Figures & data
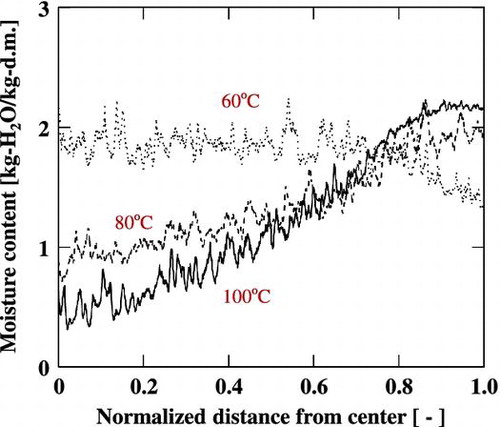
Fig. 1. Moisture distributions of spaghetti rehydrated at 60 °C (∙ ∙ ∙), 80 °C (‒ ‒), and 100 °C (―) in distilled water.
Fig. 2. Representative examples of stress–strain curves for spaghetti rehydrated at 60 °C (∙ ∙ ∙), 80 °C (‒ ‒), and 100 °C (―) in distilled water.
Fig. 3. Relationship between rehydration temperature and breaking stress (○) or breaking strain (□).
Fig. 4. Moisture distributions of spaghetti rehydrated at 100 °C in distilled water (―), 0.1 mol/L NaCl solution (‒ ‒), 1.0 mol/L NaCl solution (∙ ∙ ∙), and 2.0 mol/L NaCl solution (‒ ∙).
Fig. 5. Representative examples of stress–strain curves for spaghetti rehydrated at 100 °C in distilled water (―), 0.1 mol/L NaCl solution (‒ ‒), 1.0 mol/L NaCl solution (∙ ∙ ∙), and 2.0 mol/L NaCl solution (‒ ∙).
Fig. 6. Relationship between the concentration of the NaCl solution and breaking stress (○) or breaking strain (□).