Figures & data
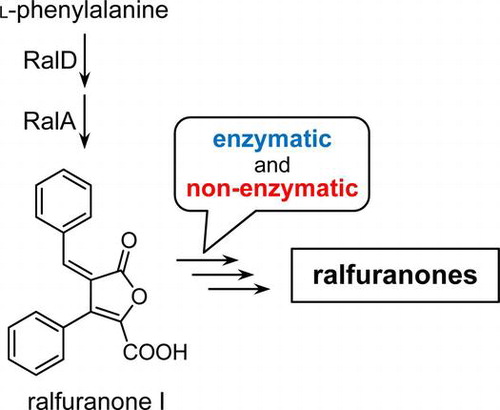
Fig. 1. Structures of ralfuranones.
Fig. 2. HPLC chromatograms of EtOAc extracts from ∆ralA cultures fed with 2.5 μM (A) and 200 μM ralfuranone I (6) (B) and MGRLS medium fed with 2.5 μM ralfuranone I (6) (C). The peaks of ralfuranones were marked with arrowheads.
Fig. 3. HPLC chromatograms of EtOAc extracts from ∆ralA cultures (A) and MGRLS medium fed with 10 μM ralfuranone B (2) (B). The peaks of ralfuranones were marked with arrowheads.
Scheme 1. Biosynthetic pathway of ralfuranone I (6) from l-phenylalanine. RalD is the pyridoxal phosphate-dependent aminotransferase. RalA is the NRPS-like furanone synthase composed of adenylation (A), thiolation (T), and thioesterase (TE) domains.
Scheme 2. Proposed conversion pathway from ralfuranone I (6) to other ralfuranones.