Figures & data
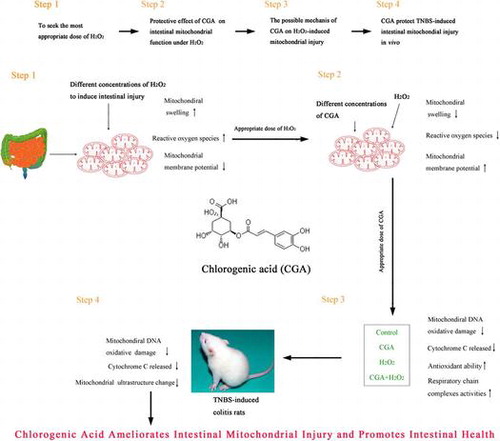
Fig. 1. Effects of different concentrations of H2O2 on mitochondrial function. Intestinal mitochondria were treated with 0.125, 0.25, 0.5, or 1 M H2O2 for 50 min. Mitochondrial swelling (A) was measured by monitoring the absorbance at 540 nm. Mitochondrial membrane potential changes (B) were indicated by Rhodamine 123 fluorescence after staining mitochondria with Rhodamine 123. Mitochondrial ROS production (C) was measured following incubation of mitochondria with DHA with the use of Rhodamine 123 fluorescence.
Fig. 2. CGA alleviated H2O2-induced injury to isolated intestinal mitochondria. Intestinal mitochondria were treated with 0.5 mM H2O2 or a combination of H2O2 and CGA (CGA + H2O2). CGA was added 5 min prior to treatment. Mitochondrial swelling (A), mitochondrial membrane-potential change (B), mitochondrial ROS production (C), content of 8-OHdG in mitochondrial fractions (D), content of cytochrome c in mitochondrial fractions (E), and content of cytochrome c in mitochondrial supernatant (F) are shown.
Table 1. Effects of CGA on activities of T-AOC, SOD, and GSH-Px in mitochondrial fractions.
Table 2. Effects of CGA on intestinal mitochondrial respiratory chain complexes.
Fig. 3. CGA ameliorates colonic injury in TNBS-induced colitis rat. Histological findings of proximal colon samples stained with hematoxylin and eosin (A). Arrows indicate inflammatory cells. Histological injury scoring (B) indicated a grading scale for histological assessment of inflammation in colitis. The length of colon (C), weight of colon (D), activity of MPO (E), and ALP (F).
Fig. 4. CGA alleviated TNBS-induced mitochondrial injury and ultrastructural changes. Ultrastructure of mitochondria (A), arrows in control and CGA groups show the normal mitochondrial ultrastructure. Arrows in the TNBS group show mitochondrial ultrastructural changes, such as swelling and lost cristae. Arrows in the CGA + TNBS group indicate amelioration of mitochondrial ultrastructural changes. Mitochondrial damage score (B), the content of 8-OHdG (C) and cytochrome c (D) in mitochondria, and cytochrome c in cytoplasm (E) are shown.