Figures & data
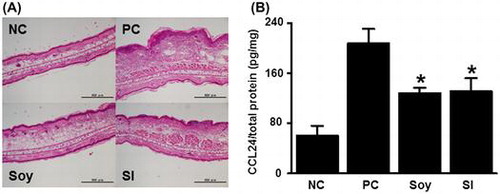
Fig. 1. Feeding mice with soybean and SI attenuates ear swelling due to contact allergy.
Notes: BALB/c mice were fed either MF/acidified water (soy-treated group, n = 6), F2PLD1/0.1% Soyaflavone HG (soy isoflavone- (SI) treated group, n = 6), or F2PLD1/acidified water (negative control group, n = 3, and positive control group, n = 6). Mice in each group were sensitized (S) with 0.5% 2,4-dinitrofluorobenzene (DNFB), and were challenged (C) with 0.15% DNFB. The negative control mice were sensitized and challenged with vehicle. Ear thickness was measured using a micrometer and ear swelling was calculated as the difference in ear thickness before and after the challenge. (A) Experimental protocol. (B) Ear swelling 24 h after the second DNFB challenge. NC, negative control group; PC, positive control group; Soy, soy-treated group; SI, SI-treated group. Each value represents the mean ± SEM. Data are representative of 3 independent experiments with similar results; **p < 0.01 vs. the positive control.
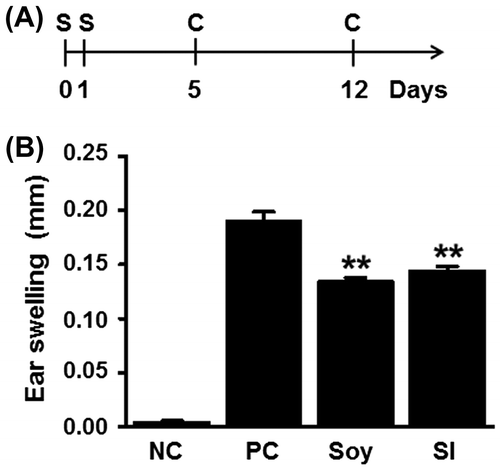
Fig. 2. Histopathological images of DNFB-challenged mouse ears.
Notes: Mice were sensitized and challenged as described in Fig. 1. Ear tissues were collected 24 h after the second challenge and fixed with zinc for 24 h. Paraffin-embedded ear tissue sections were stained with hematoxylin and eosin. (A) Negative control. (B) Positive control. (C) Soy-treated. (D) Soy isoflavone- (SI) treated. Scale bars, 500 μm.
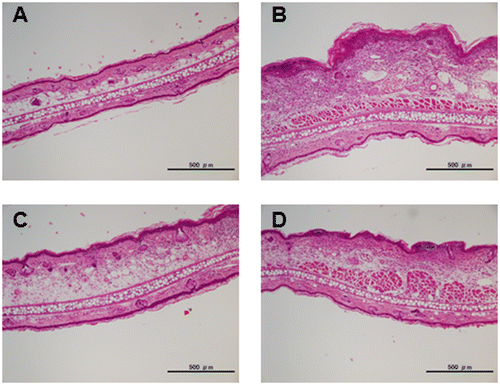
Fig. 3. Feeding mice with soybean and SI inhibits the infiltration of myeloid immune cells.
Notes: Paraffin-embedded ear tissue sections were prepared as described in the figure legend of Fig. 2. These sections were immunohistochemically (IHC) stained with an anti-Gr-1 antibody. IHC-stained ear tissue images of (A) positive control, (B) soy-treated, and (C) soy isoflavone-(SI) treated mice. Gr-1-positive cells were stained dark-brown and cell nuclei were stained blue with hematoxylin. Scale bars, 200 μm. (D) The number of Gr-1-positive cells infiltrating into ear tissues. PC, positive control group; Soy, soy-treated group; SI, SI-treated group. Each value represents the mean ± SEM of measurements from 6 mice each. Data are representative of 2 independent experiments with similar results; **p < 0.01 vs. the positive control.
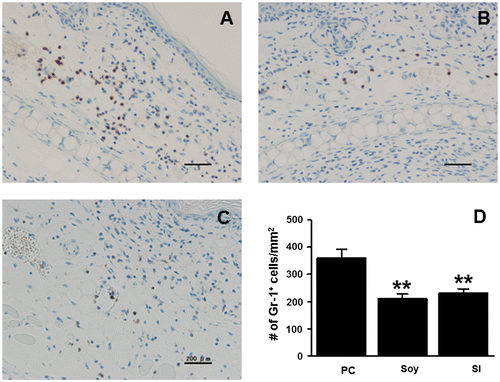
Table 1. Cytokine genes downregulated in the soy-treated mouse compared with the positive control as determined by DNA microarray analysis.
Fig. 4. Effect of feeding mice with soybean and SI on Ccl24 and Xcl1 mRNA expression.
Notes: Mice were sensitized and challenged as described in Fig. 1. Ear tissues of mice were collected 24 h after the second challenge. Expression of Ccl24 and Xcl1 mRNA levels were determined by real-time PCR. Actb (β-actin) was used as a control for normalization. (A) Ccl24 mRNA expression. (B) Xcl1 mRNA expression. PC, positive control group; Soy, soy-treated group; SI, soy isoflavone- (SI) treated group. Each value represents the mean ± SEM of measurements from groups of six mice each; *p < 0.05 vs. the positive control.
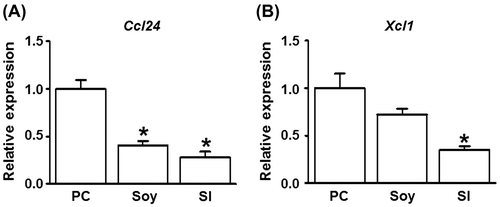
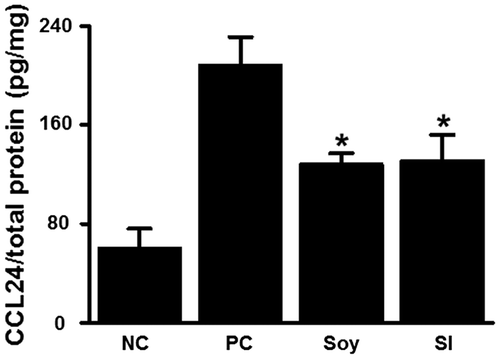
Fig. 5. Feeding mice with soybean and SI suppresses CCL24 production in ear tissues.
Notes: Mice were sensitized and challenged as described in Fig. 1. Ear tissues of the mice were collected 24 h after the second challenge. The chemokine (C-C motif) ligand 24 (CCL24) level in the ear tissues was determined via an enzyme-linked immunosorbent assay (ELISA). Total protein concentration was examined using the BCA method. NC, negative control group; PC, positive control group; Soy, soy-treated group; SI, soy isoflavone- (SI) treated group. Each value represents the mean ± SEM of measurements from groups of 6 mice each, except for the negative control (n = 3); *p < 0.05 vs. the positive control.