
Figures & data
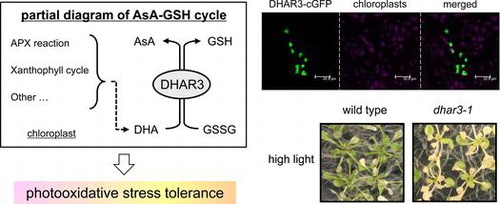
Fig. 1. Sub-cellular localization of DHAR3.
Notes: Confocal images of Arabidopsis leaf cells transiently expressing (A) GFP alone (pGWB506 empty vector) and (B) DHAR3-cGFP. Left and middle panels indicate GFP fluorescence and auto-fluorescence from chloroplasts, respectively. The right panel shows fluorescence images merged with bright-field images. Scale bars are 20 μm. The same results were obtained from more than 3 independent experiments.
Fig. 2. Characterization of T-DNA insertion lines lacking DHAR3.
Notes: (A) Molecular structure and T-DNA insertion site of the DHAR3 (dhar3: SAIL_435_A09) gene. T-DNA insertion site is indicated with a triangle, and black and white boxes represent coding and non-coding regions, respectively. (B, C) Wild-type and dhar3 mutant plants were grown under normal conditions for 2 weeks. (B) Transcript levels of DHAR3 and Actin8 were analyzed by semi-quantitative RT-PCR. (C) DHAR activity in plants was measured. Data are means ± SD for more than 3 biological replicates.
Fig. 3. Sensitivity of dhar3 mutants to photo-oxidative stresses.
Notes: Two-week-old wild-type and dhar3 mutant plants were exposed to eHL (1500 μmol photons m−2 s−1). Plants were photographed (A) before stress application and (B) 15 h after eHL irradiation. The same results were obtained from more than 3 independent experiments. (C) Total ascorbate levels and (D) ascorbate redox states were measured and calculated. Data are means ± SD for more than 6 biological replicates. Significant differences: *p < 0.05 vs. the value for the wild-type plants.
Fig. 4. DHAR, MDAR, and GR in dhar3 mutants under high light.
Notes: Two-week-old wild-type and dhar3 mutant plants were subjected to HL (1000 μmol photons m−2 s−1). (A) DHAR, (B) MDAR, and (C) GR activity in plants were measured. Data are means ± SD for more than 3 biological replicates. Significant differences: *p < 0.05 vs. the value for wild-type plants.
Fig. 5. Oxidative damage in dhar3 mutants under high light.
Notes: Two-week-old wild-type and dhar3 mutant plants were subjected to HL (1000 μmol photons m−2 s−1). (A) Fv/Fm in the leaves was determined after dark adaptation for 20 min, as described in the Materials and Methods. Data are means ± SD for more than 3 biological replicates. (B) Lipid hydroperoxide contents were determined by measuring malondialdehyde. Data are means ± SD for more than 3 biological replicates. Significant differences: *p < 0.05 vs. the value for wild-type plants.
Fig. 6. Levels and redox states of ascorbate in dhar3 mutants under high light.
Notes: Two-week-old wild-type and dhar3 mutant plants were subjected to HL (1000 μmol photons m−2 s−1). (A) Total ascorbate levels and (B) ascorbate redox states were measured and calculated. Data are means ± SD for more than 6 biological replicates. Significant differences: *p < 0.05 vs. the value for wild-type plants.
Fig. 7. Levels and redox states of glutathione in dhar3 mutants under high light.
Notes: Two-week-old wild-type and dhar3 mutant plants were subjected to HL (1000 μmol photons m−2 s−1). (A) Total glutathione levels and (B) glutathione redox states were measured and calculated. Data are means ± SD for more than 6 biological replicates. Significant differences: *p < 0.05 vs. the value for wild-type plants.
Supplemental material