Figures & data
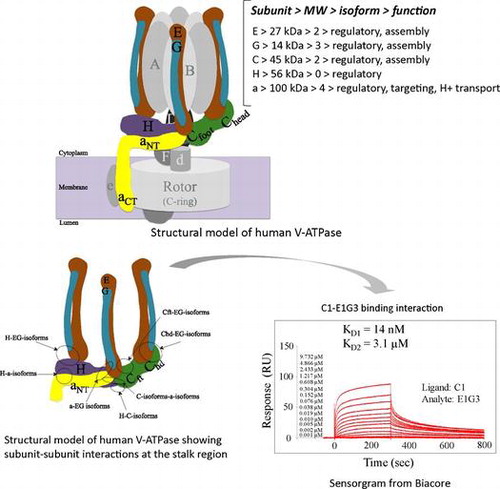
Fig. 1. Schematic model of human V-ATPase illustrating the mode of binding interactions at the peripheral stalk region.
Fig. 2. Interactions between EG isoforms and C2.
Table 1. Kinetic parameters of binary subunit–subunit binding interactions obtained by Biacore experiments.
Fig. 3. Interactions of EG-isoforms with the H subunit.
Fig. 4. Binary and ternary interactions of H-C2-isoform.
Fig. 5. Quaternary binding interactions.
Fig. 6. Multiple sequence alignment of yeast C (Vma5p), C1, and C2 subunit isoforms of human V-ATPase with other C1 and C2 subunit isoforms from different species. Conserved amino acids are highlighted by purple color. The amino acids constituting the head (red bar), neck (green bar), and foot (blue bar) regions are highlighted above the sequence according to the crystal structure of the yeast C subunit. Residues involved in dimer interfaces from PISA analysis are highlighted as yellow. Hs, H. sapiens; Mm, M. musculus; Xt, X. tropicalis; Dr, Danio rerio.
Fig. 7. Sequence alignment of the C1 and C2 subunit isoforms of human V-ATPase with other C1 and C2 subunit isoforms from different species.
Fig. 8. Consurf conservation analysis for the homology models.