629
Views
3
CrossRef citations to date
0
Altmetric
Organic Chemistry

Natural variation in the glucose content of dilute sulfuric acid–pretreated rice straw liquid hydrolysates: implications for bioethanol production

, , , , , , & show all
Pages 863-869 | Received 29 Oct 2015, Accepted 14 Dec 2015, Published online: 12 Feb 2016

Figures & data

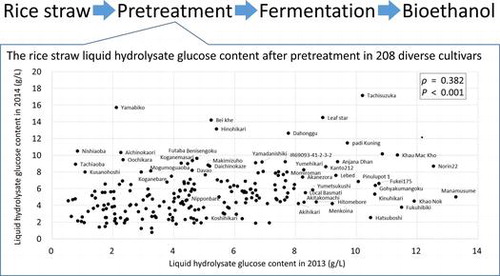
Table 1. The analysis of variance table for two-way analysis of variance.

Fig. 1. Frequency distributions of the liquid hydrolysate glucose content in 208 rice cultivars in 2013 (a) and 2014 (b).

Fig. 1. Frequency distributions of the liquid hydrolysate glucose content in 208 rice cultivars in 2013 (a) and 2014 (b).

Fig. 2. Frequency distributions of the liquid hydrolysate glucose content in (a) japonica rice cultivars in 2013, (b) indica rice cultivars in 2013, (c) japonica rice cultivars in 2014, and (d) indica rice cultivars in 2014.

Fig. 2. Frequency distributions of the liquid hydrolysate glucose content in (a) japonica rice cultivars in 2013, (b) indica rice cultivars in 2013, (c) japonica rice cultivars in 2014, and (d) indica rice cultivars in 2014.

Fig. 3. Liquid hydrolysate glucose content of 208 rice cultivars in 2013 and 2014 (a) and relationships of liquid hydrolysate glucose content and total glucose content in rice straw in 2014 (b).

Fig. 3. Liquid hydrolysate glucose content of 208 rice cultivars in 2013 and 2014 (a) and relationships of liquid hydrolysate glucose content and total glucose content in rice straw in 2014 (b).

Fig. 4. Temperature and solar radiation at the Kobe University, Food Resources Education and Research Center (Kasai, Hyogo Prefecture, Japan). Lines show the temperature in 2013 and 2014. Bars show the difference in solar radiation (the value in 2014 minus that in 2013).

Fig. 4. Temperature and solar radiation at the Kobe University, Food Resources Education and Research Center (Kasai, Hyogo Prefecture, Japan). Lines show the temperature in 2013 and 2014. Bars show the difference in solar radiation (the value in 2014 minus that in 2013).

Fig. 5. Upper and lower quartiles of glucose content in 2013 and 2014. Error bars show standard deviation.

Fig. 5. Upper and lower quartiles of glucose content in 2013 and 2014. Error bars show standard deviation.
Supplemental material

Supplementary.zip

Download Zip (241.8 KB)

Reprints and Corporate Permissions

Please note: Selecting permissions does not provide access to the full text of the article, please see our help page How do I view content?

To request a reprint or corporate permissions for this article, please click on the relevant link below:

Academic Permissions

Please note: Selecting permissions does not provide access to the full text of the article, please see our help page How do I view content?

Obtain permissions instantly via Rightslink by clicking on the button below:

If you are unable to obtain permissions via Rightslink, please complete and submit this Permissions form. For more information, please visit our Permissions help page.