Figures & data
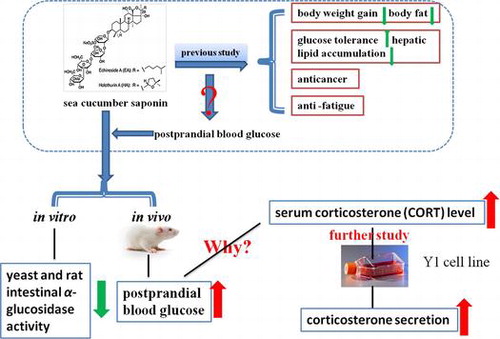
Fig. 1. HPLC analysis of total saponins extracted from P. graeffei.
Note: Experimental conditions: Column, an reverse-phase C-18 column (150 × 4.6 mm; Agilent); Gradient elution, 30% acetonitrile in 0.1% aqueous trifluoroacetic acid for 15 min, and then to 60% acetonitrile in 15 min; elution flow rate 1.0 mL/min.
Fig. 2. Structures of Holothurin A and Echinoside A.
Fig. 3. Inhibitory activities of SCS and acarbose against yeast α-glucosidases (A, B) and rat intestinal α-glucosidases (C, D).
Note: Results are means ± SEM of three independent experiments.
Fig. 4. Lineweaver–Burk plot of the reaction of yeast α-glucosidases in the presence of SCS.
Note: Using the pNPG as a substrate in the absence or presence of SCS at different concentrations.
Fig. 5. Effect of SCS administration on blood glucose level.
Note: (A) control: starch + saline; SCS: starch + SCS; acarbose: starch + acarbose. (B, C) control: saline; SCS: SCS + saline. Blood glucose was measured by assay kit. Results are expressed as mean ± SEM; n = 8 mice per group. *p < 0.05, **p < 0.01 versus control group.
Fig. 6. Effects of SCS administration on serum CORT level.
Note: control:saline; SCS: SCS + saline. Results are expressed as mean ± SEM; n = 8 mice per group. *p < 0.05, **p < 0.01 versus control group.
Fig. 7. Effects of SCS on CORT secretion in Y1 cells.
Note: Cells were incubated with 40 ng/mL EA or HA. The results are presented as the mean ± SEM. a, b, and c means with different superscripts among SCS and control groups are significantly different (p < 0.05, one-way ANOVA).