Figures & data
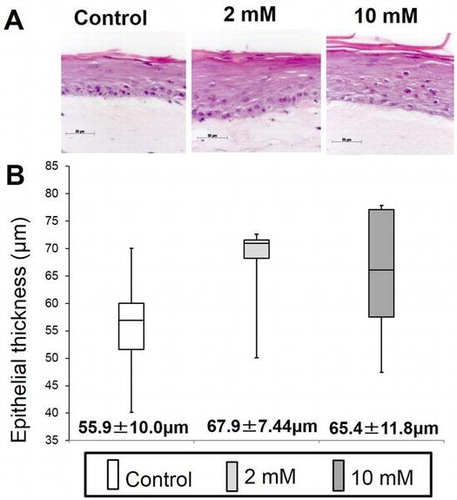
Fig. 1. Diagram showing the structure of β-D-xylopyranoside-n-propane-2-one (XPP)
Fig. 2. Viability measurement of oral keratinocytes and fibroblasts in a monolayer culture supplemented with 0 (control), 2, or 10 mM XPP.
Fig. 3. Measurement of sulfated-glycosaminoglycans (s-GAG) of oral keratinocytes and fibroblasts in a monolayer culture supplemented with 0 (control), 2, or 10 mM XPP.
Fig. 4. Effect of XPP on epithelial regeneration in an in vitro 3D oral mucosa model (3DOMM).
Fig. 5. Measurement of sulfated-glycosaminoglycans (s-GAG) in EpiLife® with 1.2 mM Ca2+ of 3DOMMs treated with 0 (control), 2 and 10 mM XPP. (n = 11).
Fig. 6. Electrophoresis of GAGs on cellulose acetate membrane.
Fig. 7. HPLC analysis of unsaturated disaccharides derived from cell-associated GAGs after lyase treatment.
Table 1 Unsaturated disaccharide compositions of cell-associated ChS chains.
Table 2. Unsaturated disaccharide compositions of cell-associated HS/Hep chains.
Fig. 8. Expression of BMZ marker proteins. Immunoblotting detection of type IV collagen, laminin-5, nidogen-2, integrin α6, and integrin β1 in 3DOMMs treated with 0, 2, or 10 mM XPP.
Fig. 9. Expression of PGs. Immunoblotting detection of decorin, syndecan-1, and CD44 in 3DOMMs treated with 0, 2, or 10 mM XPP.
Fig. 10. Expression of Akt/mTOR signaling substrates. Immunoblotting detection of p-Akt, Akt, p-S6K, S6K, p-S6 and S6 in 3DOMMs treated with 0, 2, or 10 mM XPP.
Fig. 11. Expression and immunolocalization of proteins used in immunoblot analysis in 3DOMMs treated with 0, 2, or 10 mM XPP.