1,373
Views
21
CrossRef citations to date
0
Altmetric
Regular Papers

Phenotypes of gene disruptants in relation to a putative mitochondrial malate–citrate shuttle protein in citric acid-producing Aspergillus niger

, , &
Pages 1737-1746 | Received 10 Nov 2015, Accepted 25 Feb 2016, Published online: 18 Apr 2016

Figures & data

Fig. 1. Metabolic pathway in relation to citric acid production in A. niger.
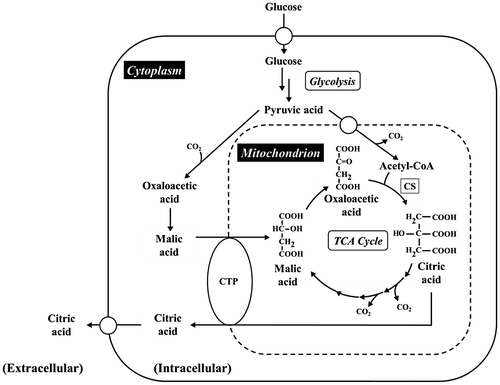
Notes: CS, citrate synthase; CTP, citrate transport protein; TCA cycle, tricarboxylic acid cycle. Empty circles indicate transport protein. Mitochondrial membrane is indicated by the dotted lines.
Fig. 1. Metabolic pathway in relation to citric acid production in A. niger.

Table 1. Primers used for transcriptional analyses.

Fig. 2. Amplifications of CTP1 homolog genes by PCR and reverse-transcription PCR.
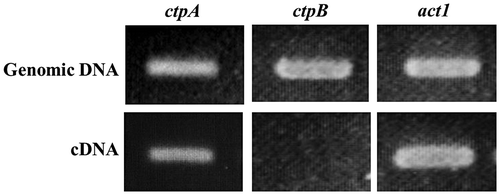
Notes: Genomic DNA and total RNA were isolated from A. niger WU-2223L cultivated under the conditions of citric acid production for 3 days at 30 °C at 120 rpm. The ctpA and ctpB are the genes encoding proteins showing high homologies to CTP1. The actin gene (act1) was used as an internal standard.
Fig. 2. Amplifications of CTP1 homolog genes by PCR and reverse-transcription PCR.

Fig. 3. Amino acid sequence alignment of CTPs derived from A. niger WU-2223L (CTPA) and S. cerevisiae S288c (CTP1).
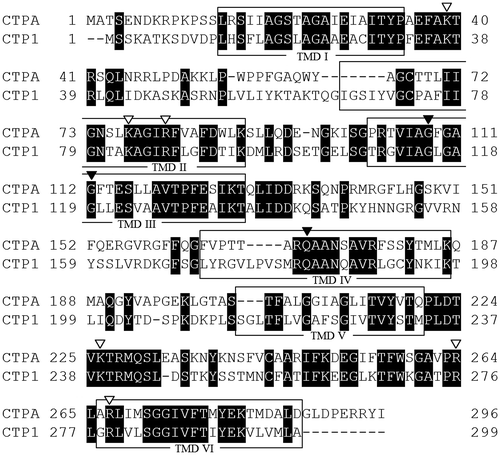
Notes: The positions of transmembrane domain (TMD) based on CTP1 sequence are framed by hollow boxes. Symbols: solid inverse triangle, residue required for dimer interface; hollow inverse triangle, residue required for transport function.
Fig. 3. Amino acid sequence alignment of CTPs derived from A. niger WU-2223L (CTPA) and S. cerevisiae S288c (CTP1).

Fig. 4. Disruption of ctpA in A. niger WU-2223L.
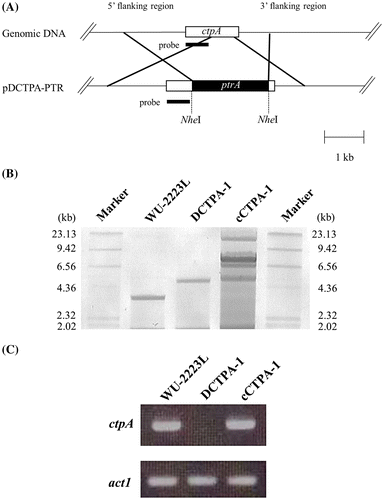
Notes: A, Schematic representation of the disruption of ctpA through homologous recombination by transformation with pDCTPA-PTR. B, Southern blot analysis of ctpA disruptant using the specific probe indicated in A. Genomic DNAs were digested with Hind III. Note that the band patterns of ctpA disruptant (DCTPA-1) and ctpA complemented strain (cCTPA-1) are different from that of WU-2223L reflecting insertion of ptrA into ctpA. Lane M, λ/EcoR I and Hind III digest. C, Transcriptional analysis of ctpA by reverse-transcription PCR. The cDNA was synthesized using total RNA isolated from mycelia cultivated under the conditions of citric acid production for 4 days. The actin gene (act1) was used as an internal standard.
Fig. 4. Disruption of ctpA in A. niger WU-2223L.

Fig. 5. Phenotypic characterization of a ctpA disruptant.
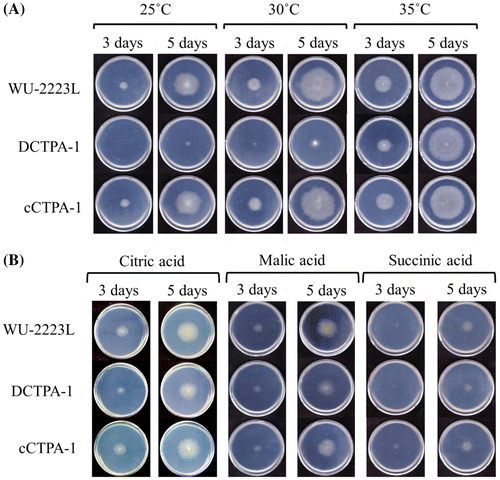
Notes: A, Growth test on A. niger WU-2223L, DCTPA-1, and cCTPA-1 on CD agar plates containing glucose as a carbon source for 3 or 5 days at 25, 30, or 35 °C. B, Growth test on A. niger WU-2223L, DCTPA-1, and cCTPA-1 on CD agar plates containing citric acid, malic acid, or succinic acid as a carbon source for 3 or 5 days at 30 °C.
Fig. 5. Phenotypic characterization of a ctpA disruptant.

Fig. 6. A, Photomicrographs of A. niger WU-2223L and DCTPA-1.
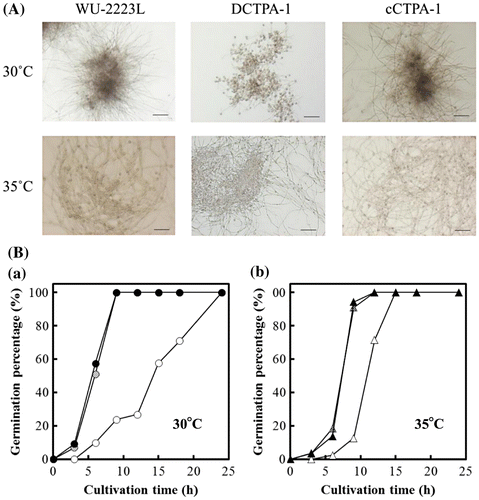
Notes: The strains were cultivated under the conditions of citric acid production for 24 hours at 30 or 35 °C, at 120 rpm. All scale bars show 50 μm. B, Germination percentage of A. niger WU-2223L (solid), DCTPA-1 (hollow), and cCTPA-1 (shaded). The strains were cultivated under the conditions of citric acid production for 24 hours at 30 °C (a) or 35 °C (b), at 120 rpm.
Fig. 6. A, Photomicrographs of A. niger WU-2223L and DCTPA-1.

Fig. 7. Dry cell weight of A. niger WU-2223L (solid), DCTPA-1 (hollow), and cCTPA-1 (shaded). The strains were cultivated under the conditions of citric acid production for 3 days at 30 (circle) or 35 °C (triangle), 120 rpm.
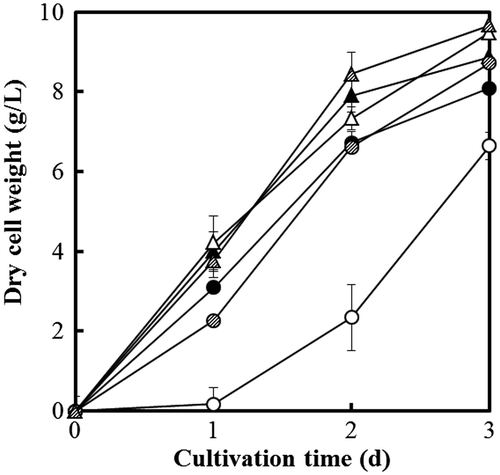
Fig. 7. Dry cell weight of A. niger WU-2223L (solid), DCTPA-1 (hollow), and cCTPA-1 (shaded). The strains were cultivated under the conditions of citric acid production for 3 days at 30 (circle) or 35 °C (triangle), 120 rpm.

Fig. 8. Citric acid production (triangle) and glucose consumption (circle) by A. niger WU-2223L (solid), DCTPA-1 (hollow), and cCTPA-1 (shaded) (A) and citric acid productivities for each strain (B).
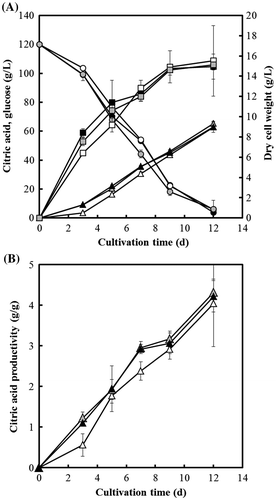
Notes: The conidia of each strain were inoculated in a citric acid production medium to a final concentration of 5.0 × 10⁶ conidia/mL, and were cultivated for 30 days at 30 °C, 120 rpm. Citric acid productivity was defined as the ratio of amount of citric acid per mycelial dry weight. The averages and the standard deviations of the three individual cultivations are shown.
Fig. 8. Citric acid production (triangle) and glucose consumption (circle) by A. niger WU-2223L (solid), DCTPA-1 (hollow), and cCTPA-1 (shaded) (A) and citric acid productivities for each strain (B).
Supplemental material

TBBB_1164583_Supplementary_Material.pdf

Download PDF (425.5 KB)

TBBB_1164583_Supplementary_Material.zip

Download Zip (383.5 KB)

Reprints and Corporate Permissions

Please note: Selecting permissions does not provide access to the full text of the article, please see our help page How do I view content?

To request a reprint or corporate permissions for this article, please click on the relevant link below:

Academic Permissions

Please note: Selecting permissions does not provide access to the full text of the article, please see our help page How do I view content?

Obtain permissions instantly via Rightslink by clicking on the button below:

If you are unable to obtain permissions via Rightslink, please complete and submit this Permissions form. For more information, please visit our Permissions help page.