
Figures & data
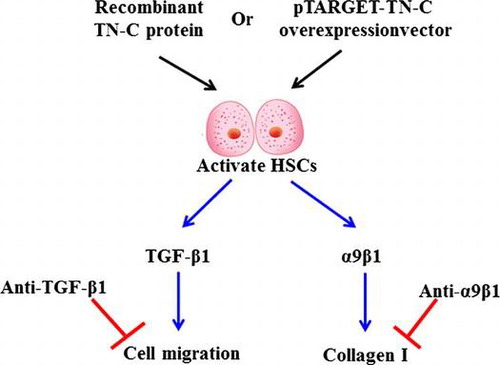
Fig. 1. TN-C level was being increased in activated HSCs.
Notes: Expression of α-SMA or TN-C in cultured HSCs (day 1 to day 7) were detected with Western blot, respectively. TN-C mRNA in cultured HSCs was detected by qRT-PCR. Also, the bands of Western blot were analyzed by Gel-Pro analyzer 4.0 software. (A) Expression of α-SMA during activation of rat HSCs. (B) Level of TN-C mRNA during activation of rat HSCs. (C) Level of TN-C protein in during activation of rat HSCs. Data were normalized based on the β-actin levels. *p < 0.05 and #p < 0.01 by Student’s test when compared with day 1.
Fig. 2. Migration of HSCs was enhanced by the rTN-C treatment.
Notes: The effect of recombinant TN-C protein on HSCs proliferation and migration were determined with BrdUassay and cell migration assay, respectively. Time-course (12, 24, 36, 48 h) and dose-response (2, 4, 6, 8 μg/μL) experiments were designed as described in methods. (A) The effect of recombinant TN-C protein on proliferation of HSCs. (B) The effect of recombinant TN-C protein on migration of HSCs. *p < 0.05 by Student’s test when compared with control group (0 μg/μL). 2 μg/μL PDGF was used as positive control molecules to compare the migration of HSCs.
Fig. 3. Expression of Collagen I was induced by the rTN-C protein treatment in HSCs.
Notes: Collagen I protein (Col I α1) and TN-C levels in HSCs were detected with Western blotting. The bands of Western blot were analyzed by Gel-Pro analyzer 4.0 software. Data were normalized based on the β-actin level. (A) and (B): The expression of Col I α1 in rTN-C treated HSCs and Col I secretion in the media. Equivoluminal DMSO and heat-denatured rTN-C treated HSCs were used as controls. (C) and (D): Expression of TN-C mRNA and protein in HSCs transfected with the pTARGET-TN-C vector. (E) and (F): Expression of Collagen I mRNA and protein in the TN-C overexpressed HSCs. (G): mRNA level of Collagen I in the TN-C overexpressed HSCs. *p < 0.05 vs control group.
Fig. 4. TGF-β1 and α9β1 were essential in the induction of collagen I by TN-C.
Notes: HSCs were pre-treated with 8 μg/μL rTN-C for 72 h. Then the cells were passaged and treated with antibodies as follows: anti-TGF-β1 Ab plus anti-α9β1, α6β4, α5β1, α3β1 integrins. IgG was used as negative control antibody. (A) and (B) The rTN-C induced Collagen I expression was inhibited by anti-TGF-β1 Ab; (C) and (D) The rTN-C induced Collagen I expression was inhibited by anti-integrin. (E) Expression of α9β1 integrin in α9β1 siRNA transfected HSCs; (F) Expression of Col I α1 in α9β1 siRNA and rTN-C treated HSCs. *p < 0.05.
Supplemental material