Figures & data
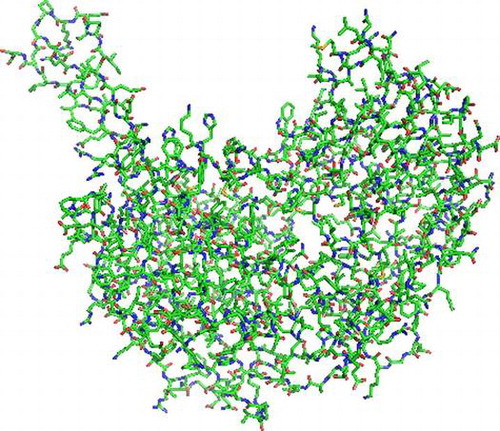
Fig. 1. Sequence and structure alignment of ALDA and BADH, ALDA shows in green, BADH shows in yellow.
Table 1. Gibbs free energy of protein-substrate interaction calculated by Amber 12, with d-glyceraldehyde as substrate.
Table 2. Substrate specificity of ALDA and mutants.
Fig. 2. Sodium dodecyl sulfate polyacrylamide gel electrophoresis analysis of ALDA and mutants. M protein markers with indicated molecular mass (kDa) indicated alongside. ALDA wild-type ALDA, H449R mutants H449R, L158Y mutantsL158Y, N286H mutants N286H, N286E mutants N286E, N286T mutants N286T.
Fig. 3. The pH optima of ALDA and its mutants, with l-lactaldehyde as substrate.
Fig. 4. Temperature optima of ALDA and mutants, with l-lactaldehyde as substrate.
Table 3. Kinetic parameters of ALDA and mutants.
Fig. 5. Effects of temperature on the stability of ALDA and mutants, with l-lactaldehyde as substrate.
Fig. 6. Superimposition of the secondary structural elements of ALDA (shown in blue) and BADH (shown in green), with residue Asn286 in ALDA, Thr290 in BADH.
Fig. 7. Superimposition of mutants and wt-ALDA. Molecules are color-coded corresponding to the coordinates of the mutational residues. The dotted yellow lines are the distances between two atoms. White is N286, yellow is H286, green is T286, blue is E286, and pink is C285.