878
Views
13
CrossRef citations to date
0
Altmetric
Regular Paper

Voluntary exercise increases IgA concentration and polymeric Ig receptor expression in the rat submandibular glandFootnote

, , , , &
Pages 2490-2496 | Received 23 Feb 2016, Accepted 15 Jul 2016, Published online: 08 Aug 2016

Figures & data

Table 1. The composition (%) of the fiber-free diet and the AIN-76 diet that was the basis of this diet.

Fig. 1. Rat body weight gain.
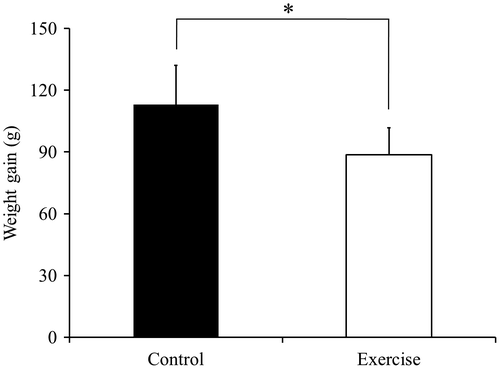
Notes: Values are the mean ± standard deviation (SD; n = 5). The control and exercise group demonstrated a significant difference in weight gain. *p < 0.05.
Fig. 1. Rat body weight gain.

Fig. 2. Concentrations of IgA in rat submandibular gland tissue.
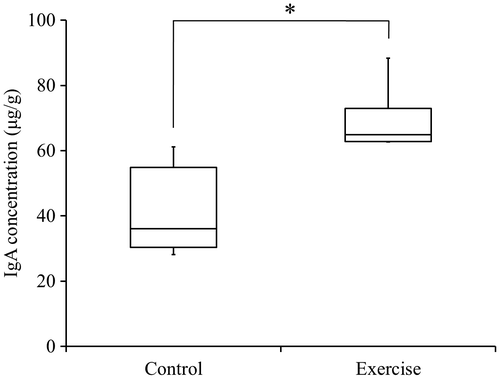
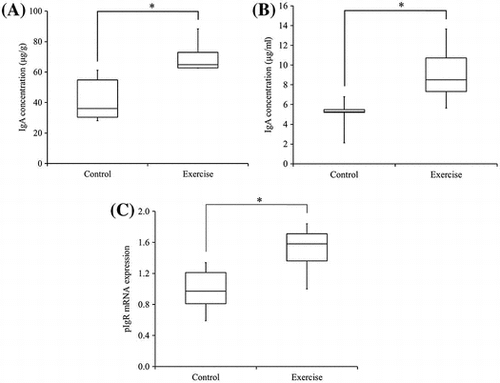
Notes: Box plots represent the smallest observation, lower quartile, median (horizontal bar), upper quartile, and largest observation (n = 5). The exercise group demonstrated significantly higher IgA concentrations in submandibular gland tissue than did the control group. *p < 0.05.
Fig. 2. Concentrations of IgA in rat submandibular gland tissue.

Fig. 3. Concentrations of IgA in rat serum.
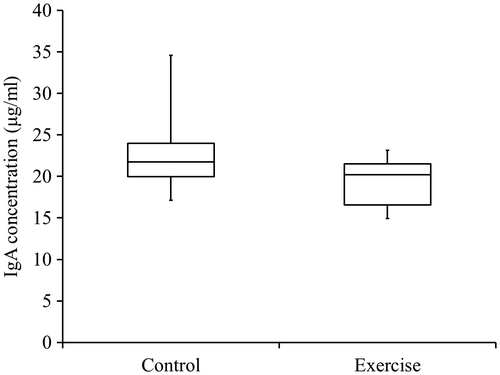
Notes: Box plots represent the smallest observation, lower quartile, median (horizontal bar), upper quartile, and largest observation (n = 5). The exercise group and the control group did not demonstrate a significant difference in serum IgA concentration.
Fig. 3. Concentrations of IgA in rat serum.

Fig. 4. Concentrations of IgA in rat saliva.
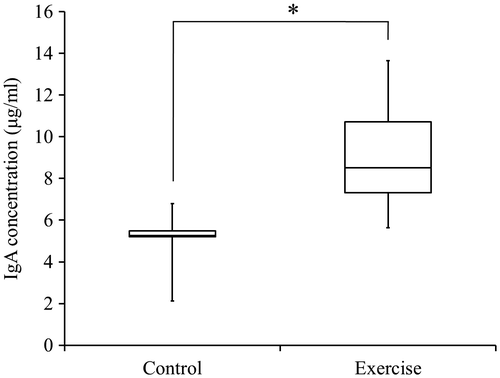
Notes: Box plots represent the smallest observation, lower quartile, median (horizontal bar), upper quartile and largest observation (n = 5). The exercise group demonstrated a significantly higher salivary IgA concentration than did the control group. *p < 0.05.
Fig. 4. Concentrations of IgA in rat saliva.

Fig. 5. Flow rate of IgA in rat saliva.
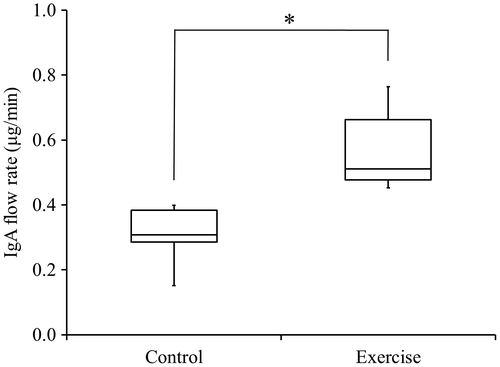
Notes: Box plots represent the smallest observation, lower quartile, median (horizontal bar), upper quartile, and largest observation (n = 5). The exercise group demonstrated a significantly faster flow rate of salivary IgA than did the control group. *p < 0.05.
Fig. 5. Flow rate of IgA in rat saliva.

Fig. 6. Expression of pIgR mRNA in rat submandibular gland tissue (pIgR/β-actin)
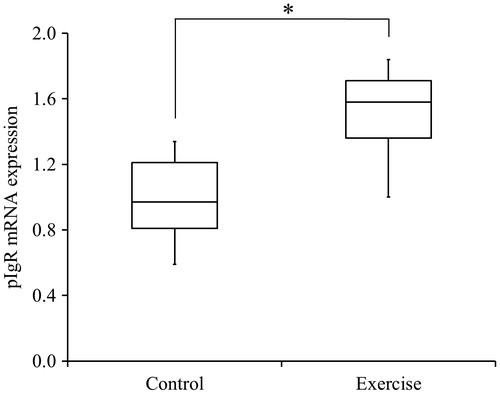
Notes: Box plots represent the smallest observation, lower quartile, median (horizontal bar), upper quartile, and largest observation (n = 5). The exercise group demonstrated significantly elevated pIgR mRNA expression in submandibular gland tissue than did the control group. *p < 0.05.
Fig. 6. Expression of pIgR mRNA in rat submandibular gland tissue (pIgR/β-actin)

Reprints and Corporate Permissions

Please note: Selecting permissions does not provide access to the full text of the article, please see our help page How do I view content?

To request a reprint or corporate permissions for this article, please click on the relevant link below:

Academic Permissions

Please note: Selecting permissions does not provide access to the full text of the article, please see our help page How do I view content?

Obtain permissions instantly via Rightslink by clicking on the button below:

If you are unable to obtain permissions via Rightslink, please complete and submit this Permissions form. For more information, please visit our Permissions help page.