Figures & data
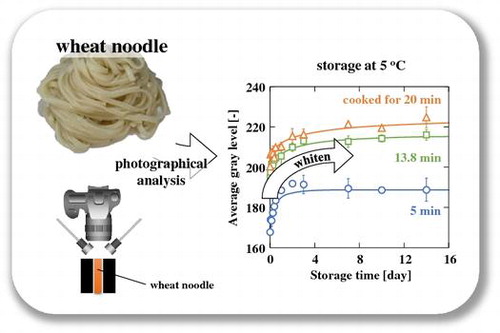
Fig. 1. Changes in the average gray level, Gt, for wheat noodles cooked for 5 (○), 13.8 (□), and 20 min (△) during storage at 5 °C.
Fig. 2. vs. log t for wheat noodles cooked for 5 (○), 13.8 (□), and 20 min (△) during storage at 5 °C.
Fig. 3. Changes in (a) breaking load and (b) fragility load, Wt, for wheat noodles cooked for 5 (○), 13.8 (□), and 20 min (△) during storage at 5 °C.
Fig. 4. Relationships between Gt/G0 and Wt/W0 for wheat noodles cooked for 5 (○), 13.8 (□), and 20 min (△) during storage at 5 °C.
Fig. 5. Changes in the average gray level, Gt, for wheat noodles containing 0 (●), 10 (□), 20 (△), and 30% (w/w) (○) chemically modified starch during storage at 5 °C.
Fig. 6. Dependence of k (○) and n (●) values on the chemically modified starch content of wheat noodles.
Fig. 7. Changes in the average gray level, Gt, at the center (○), middle (□), and surface (△) regions of wheat noodles containing (a) 0, (b) 10, (c) 20, and (d) 30% (w/w) chemically modified starch during storage at 5 °C. Note: Bars indicate standard deviation for three independent measurements.
Fig. 8. The dependence of (a) k and (b) n values on the average moisture content in wheat noodles containing 0 (●), 10 (□), 20 (△), and 30% (w/w) (○) chemically modified starch.
Fig. 9. Normalized gelatinization enthalpy, (ΔHX – ΔH0)/(ΔHe – ΔH0), vs. amount of added water, X, for wheat flour (○) and chemically modified starch (♢).