
Figures & data
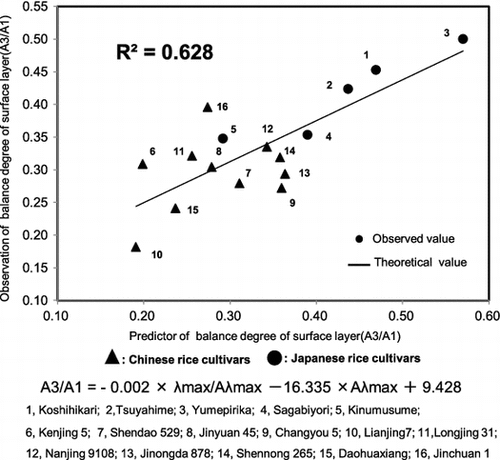
Table 1. Analysis of iodine absorption curve, amylose content, and main chemical components of milled rice.
Fig. 1. Validation test of the formula for estimating AAC in Chinese rice cultivars.
Notes: (A) Estimation formula: AAC = 73.31 × Aλmax + 0.11 × λmax – 73.02. (B) Estimation formula: AAC = −0.84 × Pt + 37.76 × SB/Con – 13.09 × Max/Min + 103.92 × Max/Fin – 8.02. 1, Kenjing 5; 2, Shendao 529; 3, Jinyuan 45; 4, Changyou 5; 5,Lianjing 7; 6, Longjing 31; 7, Nanjing 9108; 8, Jinongda 878; 9, Shennong 265; 10, Daohuaxiang; 11, Jinchuan 1.
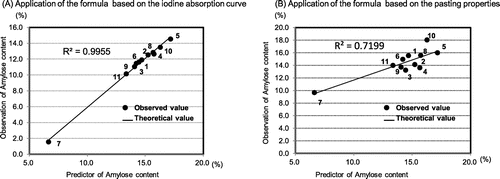
Table 2. Pasting properties of Chines and Japanese rice cultivars.
Table 3. The physical properties of the cooked rice grains.
Table 4. Correlation between physical parameters of cooked rice with analysis of iodine absorption curve, amylose contents, RS contents, pasting properties, and main chemical components of 16 Chinese and Japanese rice varieties.
Fig. 2. The starch structure was expressed as a linear function based on the relationship between λmax and “New λmax.”
Notes: The vertical axis represents λmax and the horizontal axis is “New λmax.” ▲: Chinese rice cultivars, ●: Japanese rice cultivars 1, Koshihikari; 2, Tsuyahime; 3, Yumepirika; 4, Sagabiyori; 5, Kinumusume; 6, Kenjing 5; 7, Shendao 529; 8, Jinyuan 45; 9, Changyou 5; 10, Lianjing 7; 11, Longjing 31; 12, Nanjing 9108; 13, Jinongda 878; 14, Shennong 265; 15, Daohuaxiang; 16, Jinchuan 1. Fig. 2 shows that a coefficient of determination of 0.827 was obtained due to the high correlation between λmax and “New λmax.”
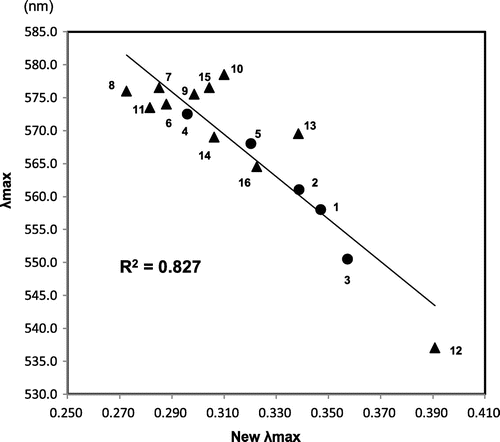
Fig. 3. Formula for estimating the balance degree of the surface layer (A3/A1) based on the iodine absorption curve of milled rice.
Notes: Estimation formula: A3/A1 = –0.002 × λmax/Aλmax – 16.335 × Aλmax + 9.428. ▲: Chinese rice cultivars, ●: Japanese rice cultivars. 1, Koshihikari; 2, Tsuyahime; 3, Yumepirika; 4, Sagabiyori; 5, Kinumusume; 6, Kenjing 5; 7, Shendao 529; 8, Jinyuan 45; 9, Changyou 5; 10,Lianjing 7; 11, Longjing 31; 12, Nanjing 9108; 13, Jinongda 878; 14, Shennong 265; 15, Daohuaxiang; 16, Jinchuan 1. The equation had a multiple coefficient of determination of 0.628 based on the calibration. Thus, we could estimate the texture (A3/A1) of the cooked rice grains based on the iodine absorption curve obtained for the milled rice.
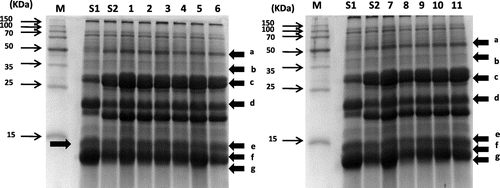
Fig. 4. SDS–PAGE analysis of proteins extracted from raw milled rice grains.
Notes: (a) polypeptide; (b) glutelin α-subunit; (c) α-globulin; (d) glutelin β-subunit, (e), (f), (g) prolamin. Shunyo is a low gluterin rice, and Koshihikari is a high-quality rice from Japan. a, Shunyo; b, Koshihikari; 1, Kenjing 5; 2, Shendao 529; 3, Jinyuan 45; 4, Changyou 5; 5, Lianjing 7; 6, Longjing 31; 7, Nanjing 9108; 8, Jinongda 878; 9, Shennong 265; 10, Daohuaxiang; 11, Jinchuan 1. Chinese rice cultivars were characterized by high-intensity 13-kDa prolamin spots, where Kenjing 5, Lianjing 7, and Nanjing 9108 had very high values.
Supplemental material