Figures & data
![](/cms/asset/8daaf682-c25f-4e36-bb42-1ca9f2de5391/tbbb_a_1222264_uf0001_oc.jpg)
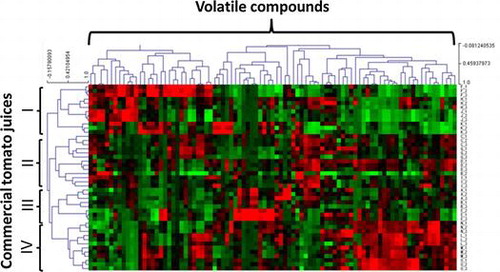
Table 1. Characteristics of the tomato juice samples used in this study.
Table 2. Compounds frequently detected as high VIP scores (>1.0) and their contribution to each sensory descriptor, lycopene content and Brix.
Fig. 1. Principal components analysis of volatile compounds. Score plot (A) and loading plot (B) for the detected volatile compounds are shown.
![Fig. 1. Principal components analysis of volatile compounds. Score plot (A) and loading plot (B) for the detected volatile compounds are shown.](/cms/asset/6eb7fb94-6435-46ad-9ae7-7685c5face05/tbbb_a_1222264_f0001_oc.gif)
Fig. 2. Relative peak intensities of ethyl acetate (A), dimethyl sulfide (B), cis-3-hexenol (C) and furfural (D) among 15 tomato juices.
![Fig. 2. Relative peak intensities of ethyl acetate (A), dimethyl sulfide (B), cis-3-hexenol (C) and furfural (D) among 15 tomato juices.](/cms/asset/5243493f-7af7-43b1-b18b-112487e72525/tbbb_a_1222264_f0002_b.gif)
Fig. 3. Hierarchical clustering of tomato juices.
![Fig. 3. Hierarchical clustering of tomato juices.](/cms/asset/16081ef7-5f7a-44e7-bb7e-da064824081c/tbbb_a_1222264_f0003_oc.gif)
Fig. 4. Correlation between apocarotenoid volatiles and lycopene content, and the pathway of synthesis of apocarotenoids from lycopene by carotenoid cleavage dioxygenase in tomato.
![Fig. 4. Correlation between apocarotenoid volatiles and lycopene content, and the pathway of synthesis of apocarotenoids from lycopene by carotenoid cleavage dioxygenase in tomato.](/cms/asset/542a88c2-aa11-4b5c-b385-6071c5378335/tbbb_a_1222264_f0004_b.gif)
Fig. 5. Correlation analysis of the PC1 values for the volatile compounds (x-axis) and sensory descriptors (y-axis) determined for the tomato juice samples.
![Fig. 5. Correlation analysis of the PC1 values for the volatile compounds (x-axis) and sensory descriptors (y-axis) determined for the tomato juice samples.](/cms/asset/4a124824-a3a4-4344-8d2d-45ca5129bc12/tbbb_a_1222264_f0005_b.gif)
Fig. 6. The first predictive component values under score and loading plots by O2PLS analysis using volatile profiles (X-variables) and sensory scores by QDA analysis (Y-variables).
![Fig. 6. The first predictive component values under score and loading plots by O2PLS analysis using volatile profiles (X-variables) and sensory scores by QDA analysis (Y-variables).](/cms/asset/1e0d44ca-1f83-4258-af0f-dc6cfdeae2f6/tbbb_a_1222264_f0006_b.gif)