Figures & data
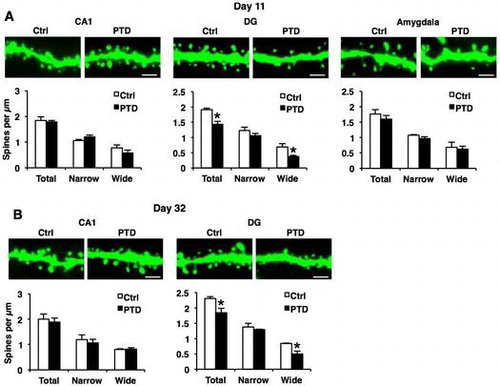
Table 1. Composition of control and TD diets.
Fig. 1. Body weight loss and ataxia by PTD treatment and its rescue by recovery treatment.
Notes: (A) Experimental procedure for the present study. (B) Weight gain during the PTD and recovery treatment periods (control [Ctrl], n = 10; PTD, n = 9). *p < 0.05, compared with PTD mice at day 11. (C) Rotarod test at days 11 and 32 (Ctrl, n = 7; PTD, n = 11). *p < 0.05, compared with PTD mice at day 11. Error bars indicate SEM.
Fig. 2. Impaired hippocampus-dependent LTM formation in PTD mice.
Notes: (A) Contextual fear conditioning task at 3 weeks after PTD (Ctrl, n = 13; PTD, n = 11). *p < 0.05, compared with PTD mice at test 2. (B, C) Morris water maze task at 3 weeks after PTD (Ctrl, n = 19; PTD, n = 19). (B) Training. *p < 0.05, compared with Ctrl mice at training days 2, 3, and 4. (C) Probe test (O, OP; R, AR; T, TQ; L, AL). *p < 0.05, compared with the other 3 quadrants; #p < 0.05. (D–G) Social recognition task. Recognition index (left panel). *p < 0.05, compared with Ctrl mice. Investigation time (right panel). *p < 0.05, compared with training. (D) STM formed at 3 weeks after PTD (Ctrl, n = 11; PTD, n = 14). (E) LTM formed at 3 weeks after PTD (Ctrl, n = 13; PTD, n = 13). (F) LTM formed at 3 months after PTD (Ctrl, n = 10; PTD, n = 12). (G) LTM formed at 6 months after PTD (Ctrl, n = 12; PTD, n = 10). Error bars indicate SEM.
Fig. 3. Normal amygdala-dependent LTM formation in PTD mice.
Notes: (A) Cued fear conditioning task at 3 weeks after PTD (Ctrl, n = 25; PTD, n = 21). (B) Conditioned aversion task at 3 weeks after PTD (Ctrl-Saline, n = 11; Ctrl-LiCl, n = 10; PTD-Saline, n = 9; PTD-LiCl, n = 10). *p < 0.05. (C) Open field test (Ctrl, n = 10; PTD, n = 10). Total path length (left panel). Percentage of time spent in the center (right panel). Error bars indicate SEM.
Fig. 4. Hippocampal neuronal loss in PTD mice.
Notes: (A) Representative immunofluorescent staining of NeuN-IR cells in the CA1, CA3, and DG regions of the hippocampus from the indicated mice at day 11. Scale bar, 100 μm (top). Quantification of the number of NeuN-IR cells (bottom; Ctrl, n = 7; PTD, n = 5). *p < 0.05, compared with Ctrl mice. (B) Representative immunofluorescent staining of NeuN-IR cells in the LA, BLA, and CeA regions of the amygdala at day 11. Scale bar, 100 μm (top). Quantification of the number of NeuN-IR cells (bottom; Ctrl, n = 6; PTD, n = 5). (C) Representative immunofluorescent staining of NeuN-IR cells in the PL and IL regions of the mPFC at day 11. Scale bar, 100 μm (top). Quantification of the number of NeuN-IR cells (bottom; Ctrl, n = 6; PTD, n = 4). (D) Representative immunofluorescent staining of NeuN-IR cells in the CA1, CA3, and DG regions of the hippocampus at day 32. Scale bar, 100 μm (top). Quantification of the number of NeuN-IR cells (bottom; Ctrl, n = 3; PTD, n = 5). *p < 0.05, compared with Ctrl mice. Error bars indicate SEM.
Fig. 5. Decreased dendritic spine density on hippocampal DG neurons in PTD mice.
Notes: (A) Representative confocal images of CA1, DG, and amygdala dendrites from the indicated mice at day 11. Scale bar, 2 μm (top). Quantification of spine density of total, narrow, and wide spines (bottom; Ctrl, n = 3; PTD, n = 3; CA1, n = 23–26 dendrites per group; DG, n = 31–32 dendrites per group; amygdala, n = 21–22 dendrites per group). *p < 0.05, compared with Ctrl mice. (B) Representative confocal images of hippocampal CA1 and DG dendrites at day 32. Scale bar, 2 μm (top). Quantification of spine density of total, narrow, and wide spines (bottom; Ctrl, n = 3; PTD, n = 3; CA1, n = 32–36 dendrites per group; DG, n = 57–58 dendrites per group). *p < 0.05, compared with Ctrl mice. Error bars indicate SEM.