
Figures & data
Fig. 1. Schematic diagram of pha operons on the genome sequences of B. bataviensis JCM 21706T and two representative species.
Notes: Colored arrows represent pha genes. The numbers show length of spacer sequences (bp). B. bataviensis JCM 21706T had 3 homologs of phaRC on the genome, one of which shown above with their accession numbers was cloned and analyzed in this study. The sspD encodes small-acid-soluble spore protein.
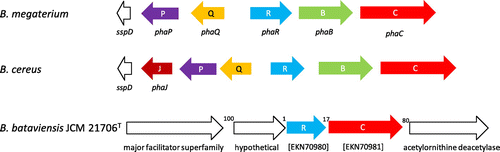
Fig. 2. 1H-NMR spectra of a PHA sample synthesized from glucose by E. coli JM 109 harboring B. bataviensis phaRC genes (pGEM”PhaRCBbAB).
Note: Signal from water is marked with asterisk.
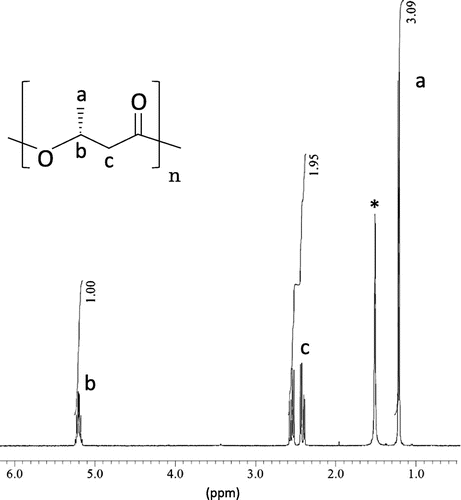
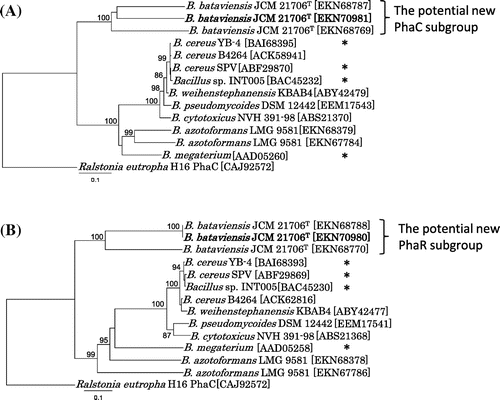
Fig. 3. Phylogenetic trees of (A) PhaC proteins and (B) PhaR proteins from Bacillus species. B. megaterium,Citation14) B. cereus YB-4,Citation11) INT005,Citation13) and SPVCitation15) marked with asterisks are previously known PhaRC proteins.
Notes: The bold letters represent the PhaRC proteins analyzed in this study. Bootstrap values (expressed as percentages of 1000 replications) >70% are shown at the branch points. Scale bar = 0.1 substitution per amino acid position.
Supplemental material