Figures & data
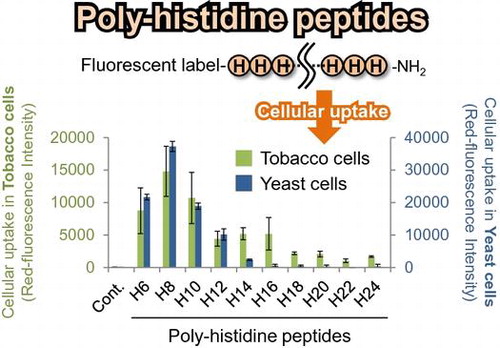
Table 1. Sequence and net charge of the PHPs used this study.
Fig. 1. Cellular uptake of PHPs into BY-2 plant cells.
Notes: (A) The BY-2 plant cells were treated with TAMRA–PHPs (1 μM) in LS medium (pH 5.8) for 12 h at 27 °C and cellular uptake of the TAMRA–PHPs was observed under CLSM. (B) After PHPs treatment, plant cell walls were removed by enzymatic treatment (protoplast preparation). The TAMRA–PHPs retained in the BY-2 protoplasts were observed under CLSM. (C) Cellular uptake of PHPs was quantified by measuring the red-fluorescence intensity of over 100 protoplasts under CLSM. Data represent the mean ± SD.
Fig. 2. Cellular uptake of PHPs into NMY51 yeast cells.
Notes: (A) The NMY51 yeast cells were treated with TAMRA–PHPs (10 μM) in YPD medium (pH 5.8) for 1 h at 30 °C and cellular uptake of the TAMRA–PHPs was observed under CLSM. (B) After PHPs treatment, yeast cell walls were removed by enzymatic treatment (protoplast preparation). The TAMRA–PHPs retained in the yeast protoplasts were observed under CLSM. (C) Cellular uptake of PHPs was quantified by measuring the red-fluorescence intensity of over 100 protoplasts under CLSM. Data represent the mean ± SD.
Fig. 3. Distribution and cellular uptake route of PHPs in the BY-2 plant cells.
Notes: (A) Intracellular distribution of short and long PHPs. Red fluorescence indicates the TAMRA–PHPs. Blue-White fluorescence indicates cell wall stained with Fluorescent Brightener 28 and nuclei stained with Hoechst 33258. Green fluorescence indicates vacuole stained with BCECF-AM. Distributions of the TAMRA–PHPs and organelles were quantified by measuring fluorescence intensity in the line areas between two asterisks. (B) Influence of temperature on cellular uptake of PHPs. The BY-2 plant cells were treated with TAMRA–PHPs (1 μM) in LS medium (pH 5.8) for 12 h at 4 °C. Cellular uptake of the TAMRA–PHPs was observed under CLSM. (C) Influence of net charge on cellular uptake of PHPs. The BY-2 plant cells were treated with TAMRA–PHPs (1 μM) in pH-modulated LS medium (pH 7.4) for 12 h at 27 °C. Cellular uptake of the TAMRA–PHPs was observed under CLSM. Net charges of PHPs at pH 7.4 are shown in Table .
Fig. 4. Distribution and cellular uptake route of PHPs in the NMY51 yeast cells.
Notes: (A) Intracellular distribution of short and long PHPs. Red fluorescence indicates the TAMRA–PHPs. Blue-White fluorescence indicates cell wall stained with Fluorescent Brightener 28 and nuclei stained with Hoechst 33258. Green fluorescence indicates vacuole stained with BCECF-AM. Distributions of the TAMRA–PHPs and organelles were quantified by measuring fluorescence intensity in the line areas between two asterisks. (B) Influence of temperature on cellular uptake of PHPs. The NMY51 yeast cells were treated with TAMRA–PHPs (10 μM) in YPD medium (pH 5.8) for 1 h at 4 °C. Cellular uptake of the PHPs was observed under CLSM. (C) Influence of net charge on cellular uptake of PHPs. The NMY51 yeast cells were treated with TAMRA–PHPs (10 μM) in pH-modulated YPD medium (pH 7.4) for 1 h at 30 °C. Cellular uptake of the TAMRA–PHPs was observed under CLSM. Net charges of PHPs at pH 7.4 are shown in Table .