1,021
Views
8
CrossRef citations to date
0
Altmetric
Environmental Science

Culture-independent study of bacterial communities in tropical river sediment

, , , , , , & show all
Pages 200-209 | Received 08 Jun 2016, Accepted 31 Aug 2016, Published online: 27 Sep 2016

Figures & data

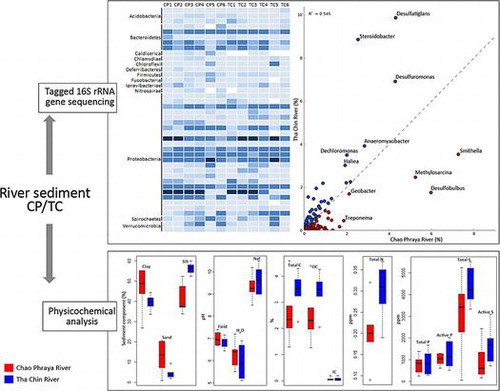
Table 1. Physicochemical properties of sediments of the Chao Phraya and the Tha Chin rivers in Thailand.

Fig. 1. Principal Component Analysis and White’s non-parametric t-test of (A) sediment component (percent redundancy); (B) total and active trace elements (g kg−1).

Notes: Samples from the Chao Phraya river are labeled CP1-6 and samples from the Tha Chin river are labeled TC1-6. The data are projected using the first two PCs, which explain 100 and 88.3% of the covariance for (A) and (B), respectively.
Fig. 1. Principal Component Analysis and White’s non-parametric t-test of (A) sediment component (percent redundancy); (B) total and active trace elements (g kg−1).

Table 2. Summary of pyrosequencing data-set and diversity index of the 16S rRNA gene sequences at 0.03% dissimilarity.

Fig. 2. The relative abundance and taxonomic profiles of (A) Bacteria in Chao Phraya (CP1-6) and Tha Chin (TC1-6) sediment samples; (B) Proteobacteria in Chao Phraya (CP1-6) and Tha Chin (TC1-6) sediment samples; (C) Heatmap representation of the major bacterial orders.

Fig. 2. The relative abundance and taxonomic profiles of (A) Bacteria in Chao Phraya (CP1-6) and Tha Chin (TC1-6) sediment samples; (B) Proteobacteria in Chao Phraya (CP1-6) and Tha Chin (TC1-6) sediment samples; (C) Heatmap representation of the major bacterial orders.

Fig. 3. Relationships of microbial communities illustrated by Principal Coordinates Analysis (PCoA) of the unweighted UniFrac distance matrix.

Notes: Samples from the Chao Phraya river (circle) are labeled CP1-6 and samples from the Tha Chin river (square) are labeled TC1-6.
Fig. 3. Relationships of microbial communities illustrated by Principal Coordinates Analysis (PCoA) of the unweighted UniFrac distance matrix.

Fig. 4. Scatter plot showing relative abundances of bacterial genera from Chao Phraya with Tha Chin rivers.

Notes: Each spot represents a different assigned taxon (genus) and its relative abundance. Spots closer to the x-axis represent genera more abundant in the Chao Phraya, while spots closer to the y-axis are more abundant in the Tha Chin river. The most abundant genera are labeled on the plot. Spots on or near the dashed diagonal have equal or similar abundances found in both samples.
Fig. 4. Scatter plot showing relative abundances of bacterial genera from Chao Phraya with Tha Chin rivers.
Supplemental material

TBBB_1234927_Supplemental_Material.docx

Download MS Word (1.8 MB)

Reprints and Corporate Permissions

Please note: Selecting permissions does not provide access to the full text of the article, please see our help page How do I view content?

To request a reprint or corporate permissions for this article, please click on the relevant link below:

Academic Permissions

Please note: Selecting permissions does not provide access to the full text of the article, please see our help page How do I view content?

Obtain permissions instantly via Rightslink by clicking on the button below:

If you are unable to obtain permissions via Rightslink, please complete and submit this Permissions form. For more information, please visit our Permissions help page.