573
Views
4
CrossRef citations to date
0
Altmetric
Biochemistry & Molecular Biology

Dynamic microRNAome profiles in the developing porcine liverFootnote

, , , , &
Pages 127-134 | Received 13 May 2016, Accepted 17 Aug 2016, Published online: 05 Oct 2016

Figures & data

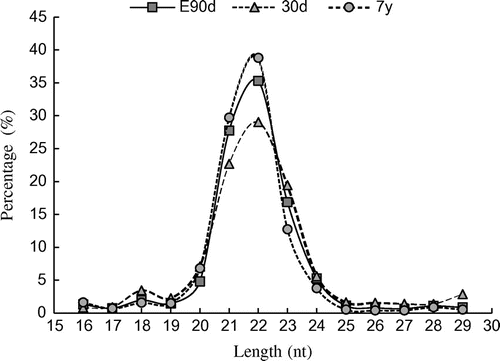
Fig. 1. Length distributions of small RNAs.

Fig. 1. Length distributions of small RNAs.

Table 1. Known and conserved miRNA identified in porcine livers (miRNA/pre-miRNA).

Table 2. Counts and types of unique known and conserved miRNAs.

Fig. 2. The 20 most highly expressed miRNAs in E90 (A), 30d (B), and 7y (C).
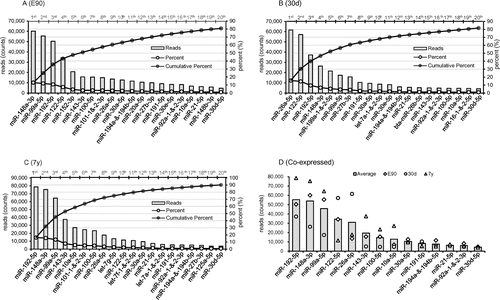
Note: The value of expression is normalized; The 14 most abundant expressed miRNAs that simultaneously appear in the top 20 position of each library are shown in (D).
Fig. 2. The 20 most highly expressed miRNAs in E90 (A), 30d (B), and 7y (C).

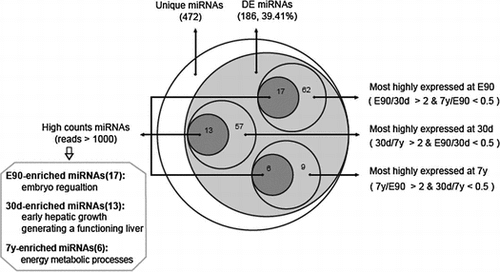
Fig. 3. Characteristics of the differentially expressed miRNAs among porcine livers at different developmental stages.
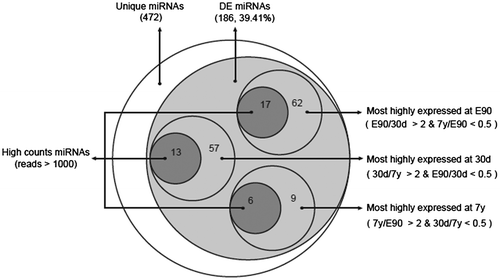
Notes: The white circle represents the 472 unique miRNAs; the large light gray circle represents the 186 differentially expressed miRNAs (fold change >2 & p- value < 0.001). Screened from these differentially expressed miRNAs, 62, 57, and 9 miRNAs were most highly expressed at E90, 30d, and 7y, respectively (small light gray circle). The dark gray circle represents those miRNAs belonging to the high-count miRNAs (reads >1000), which were also deemed stage-enriched miRNAs.
Fig. 3. Characteristics of the differentially expressed miRNAs among porcine livers at different developmental stages.

Table 3. The stage-enriched miRNAs.

Fig. 4. Characteristics of the target genes predicted from stage-enriched miRNAs.
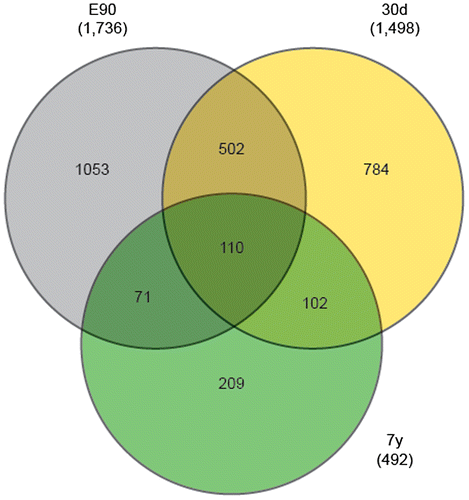
Notes: The gray circle represents the 1736 target genes predicted from the 17 miRNAs enriched at E90; the yellow circle represents the 1498 target genes predicted from the 13 miRNAs enriched at 30d; and the green circle represents the 492 target genes predicted from the 6 miRNAs enriched at 7y. A total of 110 target genes simultaneously belong to 3 libraries.
Fig. 4. Characteristics of the target genes predicted from stage-enriched miRNAs.

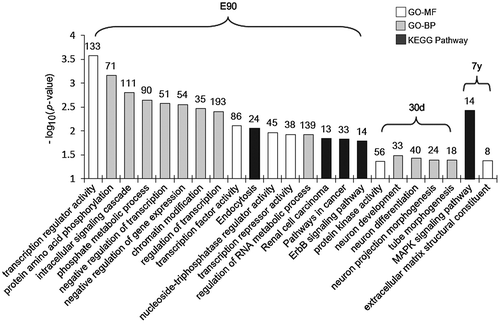
Fig. 5. KEGG pathway and gene ontology categories enriched in the stage-specific target genes.

Fig. 5. KEGG pathway and gene ontology categories enriched in the stage-specific target genes.
Supplemental material

TBBB_1240602_Supplemental_Material.zip

Download Zip (409.6 KB)

Reprints and Corporate Permissions

Please note: Selecting permissions does not provide access to the full text of the article, please see our help page How do I view content?

To request a reprint or corporate permissions for this article, please click on the relevant link below:

Academic Permissions

Please note: Selecting permissions does not provide access to the full text of the article, please see our help page How do I view content?

Obtain permissions instantly via Rightslink by clicking on the button below:

If you are unable to obtain permissions via Rightslink, please complete and submit this Permissions form. For more information, please visit our Permissions help page.