Figures & data
Table 1. Genome analysis of Streptomyces and related micro-organisms.
Fig. 1. Number of papers published per year on natural product isolation, taken from a literature search (SciFinder) for “Natural Product” between 1975 and 2014.
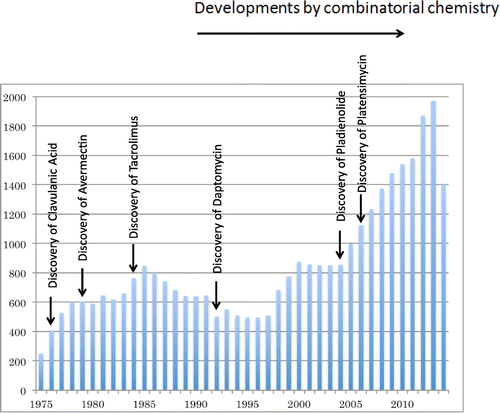
Fig. 2. Comparative analysis of chromosome structures in the genus Streptomyces and distribution of secondary metabolite biosynthesis genes (cluster).
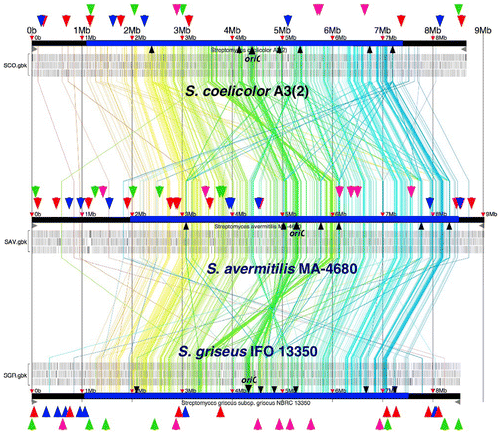
Fig. 3. Physical map of avermectin biosynthesis gene clusters: regulatory genes (orange), polyketide synthase genes (red), polyketide modification enzyme genes (blue), and glycosidation and sugar biosynthesis genes (green).
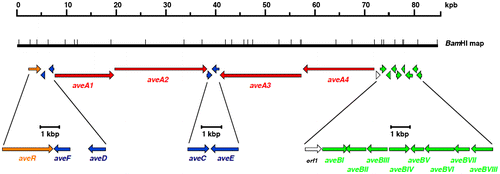
Fig. 4. Heterologous expression of gene clusters for secondary metabolite biosynthesis in an engineered S. avermitilis strain.
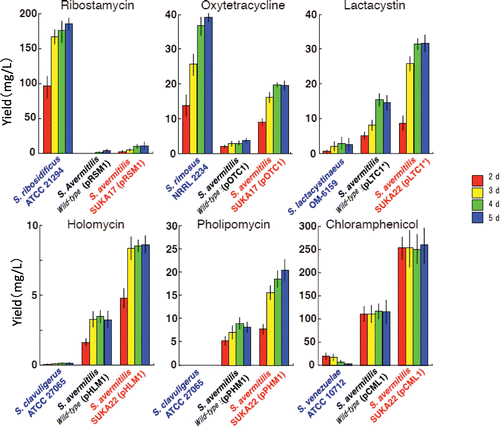
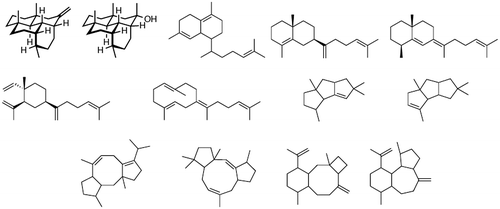
Fig. 5. Novel terpenes obtained from heterologous expression of silent terpene synthase genes.