Figures & data
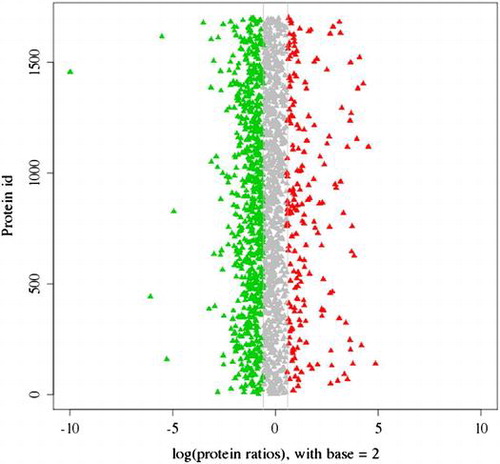
Fig. 1. The female and male sexual glands of Hyriopsis schlegelii. Blue arrows mark the spermary and ovary of Hyriopsis schlegelii.
Fig. 2. Spectra, peptides and proteins identified from iTRAQ proteomics by searching against bioinformatic database. The X-axis indicates the identification category. And the Y-axis indicates the number. Total Spectra: the total of second order spectrogram. Spectra: the number of spectrogram after the quality control. Unique Spectra: the number of spectrogram matched with special peptides. Peptide: the number of identification peptides. Unique Peptide: the number of identification special peptides. Protein: the number of identification proteins.
Fig. 3. The COG function classification of the sequences. 23 function class was represented by different capital letters under the x-axis. The y-axis denotes the number of proteins in a corresponding function class.
Fig. 4. GO classification of proteins after blastx search. Histogram presentation of the GO annotation was generated automatically by the web histogram tool WEGO (http://wego.genomics.org.cn/cgibin/wego/index.pl). The proteins were classified at the second level under three root GO domains: cellular component, molecular function and biological process. The right and left y-axes indicate the number and the corresponding percentage of a certain ontology within each root domain, respectively. One protein could be annotated into more than one GO term.
Fig. 5. The distribution of 2416 proteins based on the differential expression between spermary and ovary. Red dots and green dots indicated the up-regulated and the down-regulated proteins in ovary, respectively. Shaded dots designated the proteins that showed no obvious expression changes.
Fig. 6. The quantity statistics of differential expression proteins. The x-axis indicates the denotation of comparison groups. And the y-axis denotes the number of differential expression proteins. Red column indicates the number of up-regulated proteins, but the green column indicates the number of down-regulated proteins.