Figures & data
![](/cms/asset/e2fb4a75-4dcd-464f-87c5-00dfb8a1af17/tbbb_a_1292836_uf0001_oc.jpg)
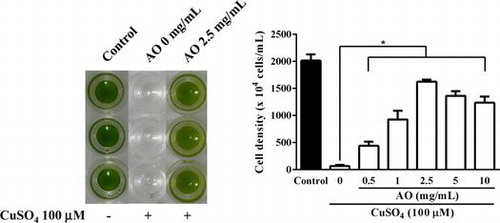
Table 1. Sequences of primers used in this study for real time PCR analysis.
Fig. 1. Effect of AO on the growth of C. reinhardtii. C. reinhardtii cells (1 × 10⁴ cells/1 mL/well in 48-well plate) were incubated with indicated concentrations of AO for 4 days at 25 °C, and the cell numbers in each well were microscopically counted. Each value represents mean ± standard deviation of triplicate measurements. * indicate significant difference between with and without AO (p < 0.05).
![Fig. 1. Effect of AO on the growth of C. reinhardtii. C. reinhardtii cells (1 × 10⁴ cells/1 mL/well in 48-well plate) were incubated with indicated concentrations of AO for 4 days at 25 °C, and the cell numbers in each well were microscopically counted. Each value represents mean ± standard deviation of triplicate measurements. * indicate significant difference between with and without AO (p < 0.05).](/cms/asset/59c92317-d962-4ade-bc99-387b1031240e/tbbb_a_1292836_f0001_b.gif)
Fig. 2. Effect of AO on cell cycle related gene expression levels in C. reinhardtii. C. reinhardtii cells (2 × 10⁶ cells/1 mL/well in 24-well plate) were incubated without (control; open column) or with 2.5 mg/mL of AO (solid column) for 24 h at 25 °C, and then cyclin A1 (CYCA1), cyclin B1 (CYCB1), and cyclin D1 (CYCD1) were analyzed by real time PCR as described in the text. GAPDH was used as an endogenous control. Each value represents mean ± standard deviation of triplicate measurements. * indicate significant difference between with and without AO (p < 0.05).
![Fig. 2. Effect of AO on cell cycle related gene expression levels in C. reinhardtii. C. reinhardtii cells (2 × 10⁶ cells/1 mL/well in 24-well plate) were incubated without (control; open column) or with 2.5 mg/mL of AO (solid column) for 24 h at 25 °C, and then cyclin A1 (CYCA1), cyclin B1 (CYCB1), and cyclin D1 (CYCD1) were analyzed by real time PCR as described in the text. GAPDH was used as an endogenous control. Each value represents mean ± standard deviation of triplicate measurements. * indicate significant difference between with and without AO (p < 0.05).](/cms/asset/632837a9-4088-47df-8312-369df6a3e24b/tbbb_a_1292836_f0002_b.gif)
Fig. 3. Effect of AO on C. reinhardtii under copper ion stress. (A) C. reinhardtii cells (1 × 10⁴ cells/1 mL/well in 48-well plate) were incubated with indicated concentrations of CuSO4 (0–100 μM) for 6 days at 25 °C, and the cell numbers in each well were microscopically counted. Each value represents mean ± standard deviation of quartette measurements. (B) C. reinhardtii cells (1 × 10⁴ cells/1 mL/well in 48-well plate) were incubated with indicated concentrations of AO (0–10 mg/mL) in the presence of CuSO4 (100 μM) for 6 days at 25 °C, and then the cell numbers in each well were microscopically counted. Solid column was control cultured under normal condition. Each value represents mean ± standard deviation of triplicate measurements. * indicates significant difference between with and without AO (p < 0.05). (C) C. reinhardtii cells (1 × 10⁴ cells/1 mL/well in 48-well plate) were cultured under normal condition (open circle), or with CuSO4 (100 μM) in the presence (semisolid circle) or absence of 2.5 mg/mL of AO (solid circle) for 6 days at 25 °C, and the cell numbers in each well were microscopically counted every day. Each value represents mean ± standard deviation of triplicate measurements.
![Fig. 3. Effect of AO on C. reinhardtii under copper ion stress. (A) C. reinhardtii cells (1 × 10⁴ cells/1 mL/well in 48-well plate) were incubated with indicated concentrations of CuSO4 (0–100 μM) for 6 days at 25 °C, and the cell numbers in each well were microscopically counted. Each value represents mean ± standard deviation of quartette measurements. (B) C. reinhardtii cells (1 × 10⁴ cells/1 mL/well in 48-well plate) were incubated with indicated concentrations of AO (0–10 mg/mL) in the presence of CuSO4 (100 μM) for 6 days at 25 °C, and then the cell numbers in each well were microscopically counted. Solid column was control cultured under normal condition. Each value represents mean ± standard deviation of triplicate measurements. * indicates significant difference between with and without AO (p < 0.05). (C) C. reinhardtii cells (1 × 10⁴ cells/1 mL/well in 48-well plate) were cultured under normal condition (open circle), or with CuSO4 (100 μM) in the presence (semisolid circle) or absence of 2.5 mg/mL of AO (solid circle) for 6 days at 25 °C, and the cell numbers in each well were microscopically counted every day. Each value represents mean ± standard deviation of triplicate measurements.](/cms/asset/0ffc3cf6-2fcb-4b3a-8c00-46d7de1b474b/tbbb_a_1292836_f0003_b.gif)
Fig. 4. Intracellular ROS levels in C. reinhardtii cells incubated under various conditions. C. reinhardtii cell suspensions containing 10 μM CM-H2DCFDA in 96-well fluorescence black plate (3 × 10⁶ cells/0.2 mL/well) were incubated under normal condition (solid column) or with CuSO4 (100 μM) in the presence of varying concentrations of AO (0–10 mg/mL) (open column) for 30 min at 25 °C, and then fluorescence intensity of each well was measured with fluorescent microplate reader. Each value represents mean ± standard deviation of triplicate measurements. * indicates significant difference between with and without AO (p < 0.05).
![Fig. 4. Intracellular ROS levels in C. reinhardtii cells incubated under various conditions. C. reinhardtii cell suspensions containing 10 μM CM-H2DCFDA in 96-well fluorescence black plate (3 × 10⁶ cells/0.2 mL/well) were incubated under normal condition (solid column) or with CuSO4 (100 μM) in the presence of varying concentrations of AO (0–10 mg/mL) (open column) for 30 min at 25 °C, and then fluorescence intensity of each well was measured with fluorescent microplate reader. Each value represents mean ± standard deviation of triplicate measurements. * indicates significant difference between with and without AO (p < 0.05).](/cms/asset/14b82036-ccf1-4bea-a5d4-d800fadfc156/tbbb_a_1292836_f0004_b.gif)
Fig. 5. Real time PCR analysis of expression levels of antioxidant enzymes in C. reinhardtii cells incubated under various conditions. C. reinhardtii cells in 24-well plate (3 × 10⁶ cells/1 mL/well) were incubated under normal condition (open column) or with AO (2.5 mg/mL) alone (solid column), CuSO4 (100 μM) alone (shaded column), or CuSO4+AO (striped column) for 24 h at 25 °C, and then expression levels of manganese superoxide dismutase 3 (MSD3), catalase 1 (CAT1), and ascorbate peroxidase 1 (APX1) were analyzed by real time PCR. GAPDH was used as an endogenous control. Each value represents mean ± standard deviation of triplicate measurements. * indicate significant difference between with and without AO (p < 0.05).
![Fig. 5. Real time PCR analysis of expression levels of antioxidant enzymes in C. reinhardtii cells incubated under various conditions. C. reinhardtii cells in 24-well plate (3 × 10⁶ cells/1 mL/well) were incubated under normal condition (open column) or with AO (2.5 mg/mL) alone (solid column), CuSO4 (100 μM) alone (shaded column), or CuSO4+AO (striped column) for 24 h at 25 °C, and then expression levels of manganese superoxide dismutase 3 (MSD3), catalase 1 (CAT1), and ascorbate peroxidase 1 (APX1) were analyzed by real time PCR. GAPDH was used as an endogenous control. Each value represents mean ± standard deviation of triplicate measurements. * indicate significant difference between with and without AO (p < 0.05).](/cms/asset/8872b410-d6e5-4ab5-9da5-8d94dcdaa1d3/tbbb_a_1292836_f0005_b.gif)