Figures & data
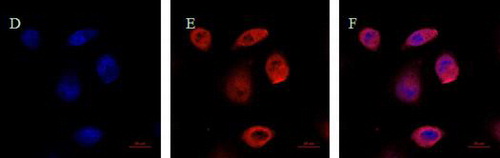
Fig. 1. Construction of the recombinant expression vector pET-28a-pRAG2 and identification of the recombinant plasmid through its digestion with restriction enzymes. (A) The pET-28a-pRAG2 plasmid was constructed as described in the text. The plasmid structure of pET-28a-pRAG2 (6874 bp). pRAG2: Recombination activating gene 2; lacI: inducible promoters; Kan: “javascript:void(0);” kanamycin-resistance marker. f1 origin: replication origin for E. coli. (B) Identification of the recombinant plasmid and digestion with restriction enzymes. M: DNA marker; Lane 1: product digested from recombinant plasmid pET-28a-pRAG2; lane 2: product digested by restriction enzymes from recombinant plasmid pET-28a-pRAG2.
Fig. 2. Determination of the induction time and expression of the RAG2 gene. M: Protein molecular weight marker; lane 1: non-pET-28a induction with IPTG for 5 h; lane 2: pET-28a-pRAG2 induction with IPTG for 1 h; lane 3: pET-28a-pRAG2 induction with IPTG for 2 h; lane 4: pET28a-pRAG2 induction with IPTG for 3 h; lane 5: pET-28a-pRAG2 induction with IPTG for 4 h; lane 6: pET-28a-pRAG2 induction with IPTG for 5 h; lane 7: pET-28a-pRAG2 induction with IPTG for 6 h; lane 8: pET-28a-pRAG2 induction with IPTG for 7 h.
Fig. 3. Solubility analysis and purification of the recombinant protein. M: Protein molecular weight marker; lane 1: negative control; lane 2: precipitate of the sonicated pET-28a-pRAG2/BL21; lane 3: supernatant of the sonicated pET-28a-pRAG2/BL21; lane 4: purified recombinant protein.
Fig. 4. Titer determination of polyclonal antibodies by ELISA and western blot analysis of the purified recombinant RAG2 protein. (A) After the last immunization, absorbance values of the anti-serum was taken and diluted at different rates. (B) The ratio of anti-serum absorbance values at 450 nm compared to negative serum. (C) Western blot analysis of the purified recombinant RAG2 protein lane 1: negative control; lane 2: purified recombinant protein.
Fig. 5. Construction of the recombinant expression vector pVAX1-pRAG2 and identification of the recombinant pVAX1-pRAG2 through its digestion with restriction enzymes. (A) The pVAX1-pRAG2 plasmid was constructed as described in the text. The plasmid structure of pVAX1-pRAG2 (4506 bp). pRAG2: swine recombination activating gene 2; CMV promoters: promoters; “javascript:void(0);” kanamycin: “javascript:void(0);” kanamycin-resistance marker. pUC origin: replication origin. (B) Identification of the recombinant plasmid and its digestion with restriction enzymes. M: DNA marker; Lane 1: product digested from the recombinant plasmid pVAX1-pRAG2; lane 2: product digested by restriction enzymes from the recombinant plasmid pVAX1-pRAG2.
Fig. 6. Detection of cell transfection and immunofluorescence microscopy assay DAPI: “javascript:void(0);” blue fluorescence; FITC: “javascript:void(0);” red fluorescence; Merge: superimposed image of the blue fluorescence and “javascript:void(0);” red fluorescence. (A), (B) and (C) The pVAX1 plasmid was transfected into the cells. (D), (E) and (F) The pVAX1-pRAG2 recombinant plasmid was transfected into the cells.
Fig. 7. Western blot analysis of the pig natural RAG2 protein and human RAG2 protein. Pig RAG2 protein and human RAG2 was recognized by the prepared anti-pRAG2 antibodies in the western blot analysis. There is a clear band at the expect site respectively. M: Protein molecular weight marker; lane 1: negative control; left lane 2: the pig natural RAG2 protein; right lane 2: the human RAG2 protein.