
Figures & data
Fig. 1. Effect of dietary calorie content on the amount of food intake. (A) The amount of food intake was measured for one day (Mean ± SD, n = 7). Means with different letters indicate significant differences on Tukey’s post hoc test and (B) Relationship between fecal pellets and the amount of food intake by crickets. 1 kJ/g (open circles), 2 kJ/g (gray circles), 4 kJ/g (open squares), and 8 kJ/g diets (closed squares) were analyzed.
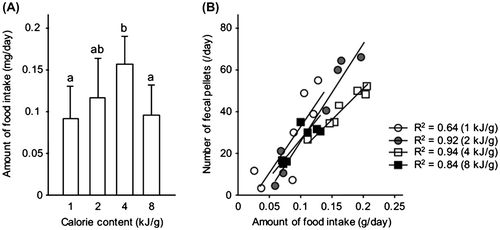
Fig. 2. Two-choice assay using crickets. (A) Schematic diagram of the assay in this study, (B) Feeding preference in macronutrient. Feeding behavior on the diets including different nutrients (high-protein diet, high-carbohydrate, and high-lipid diet) was monitored for 6 or 9 h. Open, gray and dotted boxes represent the preference indexes (PIs) for high-protein diet, high-carbohydrate, and high-lipid diet, respectively. In the box plots, bars indicate minimum and maximum; box indicates the range of quartiles and median as a second quartile. PI was calculated by counting the ratio of feeding frequency for each nutrient-containing diet (**p < 0.01 and *p < 0.05 for one-sample Wilcoxon signed rank test, n = 7–8), (C) Feeding behavior on two different diets (high-lipid diet and low-lipid diet). Dotted and hatched boxes represent the PIs for data from crickets that consumed high-lipid diet and low-lipid diet, respectively (*p < 0.05 for one-sample Wilcoxon signed rank test, n = 5), and (D) Feeding behavior on two different diets (high-lipid diet and low-lipid# diet; identical nutrient contents except for lipid ratio in these diets). Dotted and black boxes represent the PIs for data from crickets that consumed high-lipid diet and low-lipid# diet, respectively (*p < 0.05 for one-sample Wilcoxon signed rank test, n = 7).
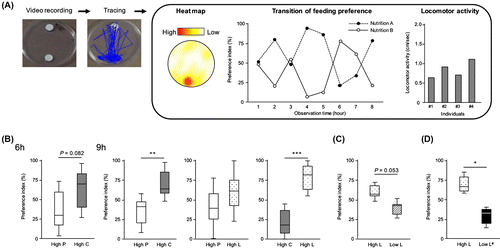
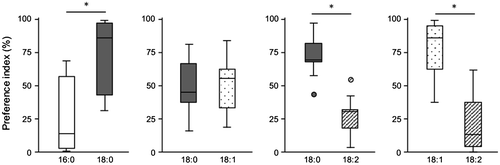
Fig. 3. Feeding preference on fatty acids. Feeding behavior on diets containing one of the four fatty acids (i.e. 16:0, 18:0, 18:1, and 18:2) was assayed for 9 h. Open, gray, dotted, and hatched boxes represent the PIs for 16:0, 18:0, 18:1, and 18:2, respectively. In the box plots, bars indicate minimum and maximum; box indicates the range of quartiles and median as a second quartile. Circles represent outliers. PI was calculated by percentiles of access frequency to two different diets (*p < 0.05 for one-sample Wilcoxon signed rank test, n = 5–10).