Figures & data
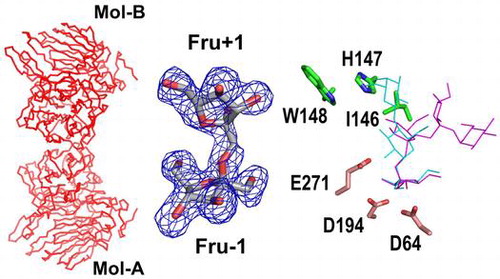
Table 1. Data collection and refinement statistics.
Figure 1. Enzymatic properties of AkFFase.
Notes: (A, B) TLC analysis of the reactions for sucrose (A) and fructose (B). Symbols: S, sucrose; F, fructose; K, 1-kestose; M, maltooligosaccharide markers; G1, glucose; G2, maltose; G3, maltotriose; G4, maltotetraose. Numbers indicate reaction times (min). Arrow represents the accumulation of 1-kestose. (C) Gel filtration chromatogram of AkFFase. (D) Determination of the molecular mass of AkFFase by gel filtration. The size markers (indicated by white circles) are: 1, blue dextran 2,000 (2,000 kDa); 2, thyroglobulin (669 kDa); 3, ferritin (440 kDa); 4, catalase (230 kDa); 5, bovine serum albumin (68 kDa); 6, ovalbumin (43 kDa). AkFFase is indicated by a black square.
Figure 2. Overall structure of AkFFase.
Notes: (A) A ribbon model of AkFFase-glycerol. Component NS (blue), a β-propeller domain (gray), an α-helical linker (orange), a C-terminal β-sandwich domain (magenta), a sodium ion (purple), and six glycerol molecules (cyan) are indicated. (B) Stereo view of component NS (blue) and the β-propeller domain of AkFFase. Five blades (I–V) are shown in cyan, green, yellow, orange, and red, respectively. Extra regions of blade V are indicated by red arrows. (C, D) Comparison of the domain composition of AkFFase (C) and MsFFase (D; PDB ID, 3WPU). The models are represented as Cα backbones. β-Propeller domains and other portions are shown in gray and magenta, respectively.
Table 2. Summary of structural similarity search using the DALI server.
Figure 3. Comparison of the Cα backbones of AkFFase and related GH32 enzymes.
Notes: (A) Stereo view of the superimposition of AkFFase (red), AjFFase (green; PDB ID, 3LF7), and XdFFase (cyan; PDB ID, 5ANN). (B) Stereo view of the superimposition of AkFFase (red) and Thermotoga maritima FFase (blue; PDB ID, 1UYP). (C) The predicted dimer structure of AkFFase composed of Mol-A and Mol-B. (D) Comparison of the dimer structures of AkFFase, XdFFase, and SoFFase. The Mol-A parts of AkFFase, XdFFase, and SoFFase are superimposed and shown in gray. The Mol-B parts of AkFFase (red), XdFFase (cyan), and SoFFase (orange) are shown.
Figure 4. Structure of the AkFFase-Fru complex.
Notes: (A) The tunnel at the bottom of the catalytic cleft of AkFFase. The route of the tunnel (cyan) was calculated using Caver. Blue balls indicate water molecules; magenta indicates the model of Fru-β-(2 → 1)-Fru bound at the catalytic cleft. (B) Stereo view of the positions of four Fru-binding sites (1)–(4) in AkFFase. The Fru molecules are shown in red. (C) The |Fo| − |Fc| omit maps for the four Fru molecules (1)–(4) at the 2.5 σ contoured level.
Figure 5. Schematic drawing of the amino acid residues interacting with Fru −1 and Fru +1.
Notes: Black circle, carbon atom; gray circle, nitrogen atom; red circle, oxygen atom; cyan circle, water molecule; green dashed line, hydrogen bond; red crown, hydrophobic interaction.
Table 3. Amino acid residues in the catalytic cleft of AkFFase and the corresponding residues in other clan GH-J enzymes.
Figure 6. Structure of the catalytic cleft of AkFFase.
Notes: (A, B) Surface models of the catalytic clefts of SoFFase (A) and AkFFase (B). Fru −1 is shown in magenta. Some key amino acid residues are indicated. (C) Stereo view of the catalytic residues (red) and the IHW sequence (green) of AkFFase. Models of nystose (magenta) and lactosucrose (cyan) are placed on the structures.