Figures & data
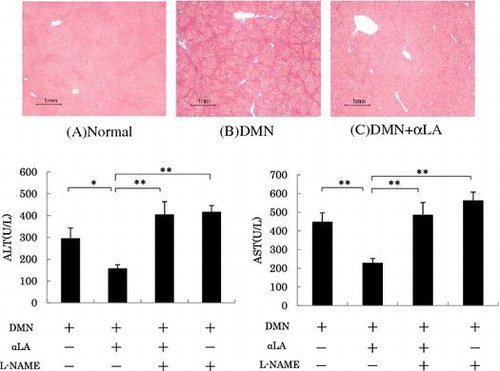
Table 1 Diet composition.
Fig. 1. Effect of αLA on ALT (A) and AST (B) levels in plasma of DMN-treated rats.
Notes: Rats were fed a standard AIN-93 M diet or an αLA-enriched diet. The plasma parameters were determined at 6, 13, 20 days after first intraperitoneally administration of DMN (1% dissolved in saline; 1 mL/kg). DMN was administered consecutively for three days each week for three weeks. Data are presented as mean ±SEM (n = 9). *, ** Significant difference from the DMN group (p < 0.05, p < 0.01).
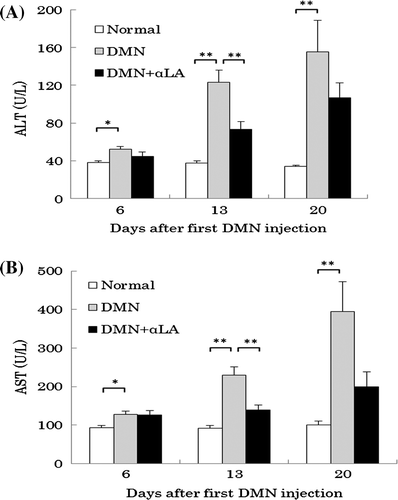
Table 2. Effect of αLA on the weights of the liver and spleen in rats treated with DMN.
Fig. 2. Effect of αLA on ALT (A), AST (B), ALP (C), total bililbin (D), MMP-2 (E), and hyaluronic acid (F) levels in plasma of DMN-treated rats.
Notes: Rats were fed a standard AIN-93 M diet or an αLA-enriched diet for 35 days. DMN was administered consecutively for three days each week for three weeks. Blood samples were collected from the abdominal aorta at 28 days after the first DMN injection. Data are presented as mean ± SEM (n = 9). *, ** Significant difference from the DMN group (p < 0.05, p < 0.01).
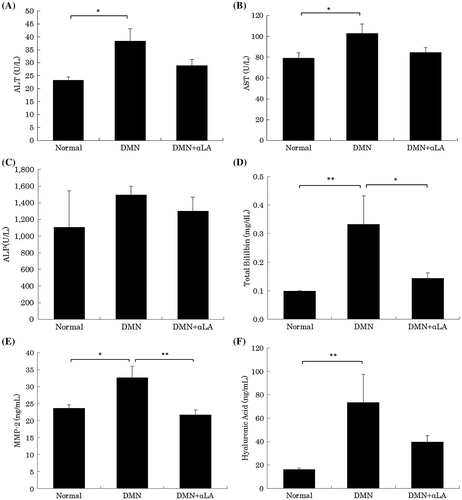
Fig. 3. Histological analysis of liver sections.
Notes: The liver of the normal rat(A), the DMN-treated rat(B) and the DMN + αLA-treated rat(C). The sections were stained with Masson trichrome. DMN was administered consecutively for three days each week for three weeks. Rats were sacrificed at 28 days after the first DMN injection.
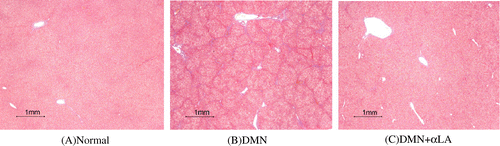
Table 3. Effect of αLA on the fibrosis grade in Masson trichrome-stained liver sections prepared from rats at 28 days after the first DMN injection.
Fig. 4. Effect of αLA on activity of ALT (A) and AST (B) levels in plasma of DMN-treated rats.
Notes: Rats were fed a standard AIN-93 M diet or an αLA-enriched diet for 17 days. The plasma parameters were determined at 10 days after first intraperitoneally administration of DMN (1% dissolved in saline; 1 mL/kg). DMN was administered consecutively for three days each week for three weeks. The L-NAME-treated groups given 0.02% L-NAME in drinking water, starting one week before the DMN injection. Data are presented as mean ± SEM (n = 9). *, ** Significant difference from the DMN group (p < 0.05, p < 0.01).
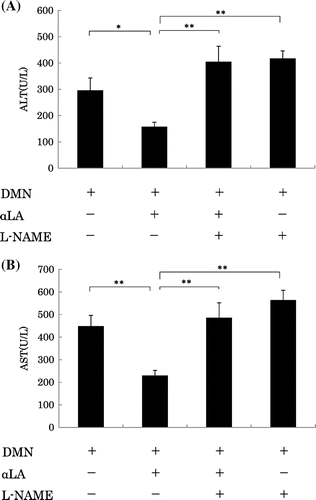
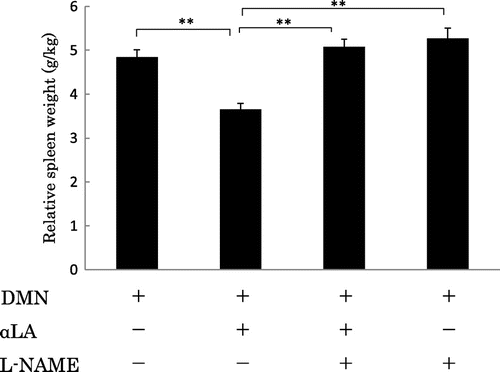
Fig. 5. Effect of αLA on relative spleen weight in rats treated with DMN.
Notes: Rats were fed a standard AIN-93 M diet or an αLA-enriched diet for 27 days. DMN was administered consecutively for three days each week for 3 weeks. The L-NAME-treated groups were given 0.02% L-NAME in drinking water, starting one week before the DMN injection. Rats were sacrificed at 20 days after the first DMN injection. Data are presented as mean ± SEM (n = 9). *, ** Significant difference from the DMN group (p < 0.05, p < 0.01).