
Figures & data
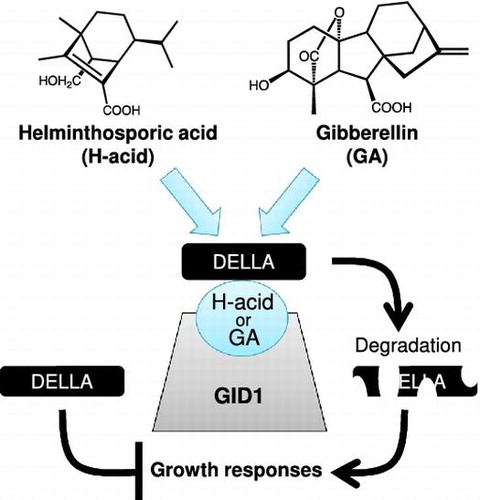
Figure 1. Chemical structure of helminthosporol and its derivatives and active GAs.
Figure 2. GA-like activity of H-acid in rice and Arabidopsis.
Notes: (A) The seedlings of the rice (Tanginbozu) are incubated for 48 h at 30 °C. The samples are dissolved in 50% (v/v) aqueous acetone and 1 μL of GA4, H-acid or acetone as mock control, and applied to the region between the coleoptile and the first leaf of a seedling. Three days later, the length of the second leaf sheath was measured. Error bars indicate ± SD. n ≥ 9. (B) The Arabidopsis WT (col) seeds were placed on half MS containing GA4, H-acid or 0.1% DMSO as mock control or Paclobutrazol (PAC). Germination was defined as the protrusion of the radicle after the seeds were transferred from 4 °C to 22 °C under continuous light for 48 h. Error bars indicate ± SD of three replicates, n ≥ 25. (C) Hypocotyl growth of WT cultivated under red light condition. The germinated seeds were transferred onto new half MS medium containing PAC or PAC and GA4 or PAC and H-acid. Two-day-old seedlings were scanned and measured with ImageJ. Error bars indicate ± S.E., n ≥ 10. (D) The germinated seeds were transferred onto new half MS medium containing 1 μM PAC or PAC and GA4 or PAC and H-acid. Eight-day-old seedlings were scanned and measured with ImageJ. Error bars indicate ± S.D., n ≥ 5. Asterisks represent significant differences derived from Student’s T-tests with the mock control (*p < 0.05, **p < 0.01).
Figure 3. H-acid regulates the expression of GA-related genes in the same manner as GA4.
Notes: (A) The seedlings of the rice (Tanginbozu) are planted in 0.8% (w/v) agar containing GA4, H-acid or 0.1% DMSO as mock control and incubated for 11 days at 30 °C. Transcript levels of OsGA20ox2 and OsGA2ox4 are relative to those of OsACT1. Error bars indicate ± SD, n = 3. (B) The Arabidopsis WT seeds were germinated and then cultivated at 22.5 °C under continuous light. Thirteen-day-old seedlings were transferred to liquid half MS, and pre-incubated. Then, GA4, H-acid or 0.1% DMSO as mock control were added to the medium and cultivated for 1 h. Transcript levels of AtGA3ox1 and AtEXP1 are relative to those of AtACT7. Asterisks represent significant differences derived from Student’s T-tests with the mock control (**p < 0.01).
Figure 4. H-acid promoted the degradation of Arabidopsis DELLA protein.
Notes: GFP fluorescence in the primary roots of 5-day-old pRGA::GFP-RGA seedlings treated with GA4, H-acid or 0.1% DMSO as the mock control for 1 h in liquid half MS. Bar = 100 μm. BF: Bright-field microscopy.
Figure 5. H-acid promotes the formation of GID1-DELLA complex.
Notes: Growth of yeast transformants for 3 days with pGBK-OsGID1 or pGBK-Vec as bait and pGAD-SLR1 as prey (A), and pGBK-AtGID1s or pGBK-Vec as bait and pGAD-RGA as prey (B) on interaction synthetic defined (SD) medium (lacking leucine, tryptophan, histidine, and adenine; –LWHA) containing GA4, H-acid or 0.1% DMSO as mock control, or SD-L-W medium as the positive control for yeast growth. For the inhibitory assay, GA-signaling inhibitor TSPC was added to the medium (C, D). Cultures were diluted at 1, 10−1 and 10−2 and spotted on plates. 3-Amino-1,2,4-triazole was added to each plate for a final concentration of 1 mM.
Figure 6. Docking simulation analysis of interaction between H-acid and OsGID1.
Notes: The docking simulation was performed with Chimera and AutoDock Vina based on the data for 3EBL from the Protein Data Bank. (A) Representative side chains of residues (gray) in OsGID1 (blue). H-acid (green) is considered to introduce hydrogen bonds (orange dash-line) with Gly 122, Ser 123 and Ser 198 in the same manner as GA4 (tan) indicated by black dash-line. (B, C) A further analysis of interactions between H-acid and OsGID1 was performed with Discovery Studio and displayed with 2D and 3D charts.
Supplemental material