Figures & data
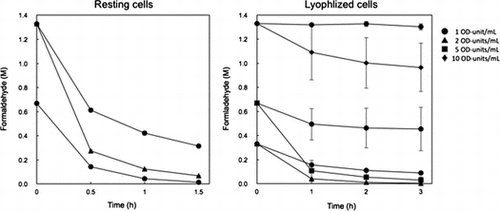
Table 1. Primers for PCR amplification of the formaldehyde dismutase gene of FD1.
Figure 1. Hydrophobic interaction chromatography of FD1 formaldehyde dismutase. The solid line, relative formaldehyde dismutase activity; the dashed line, the concentration of ammonium sulfate. (A) and (B) were the fractions with relatively high formaldehyde dismutase activity. Experimental conditions are specified in Materials and methods.
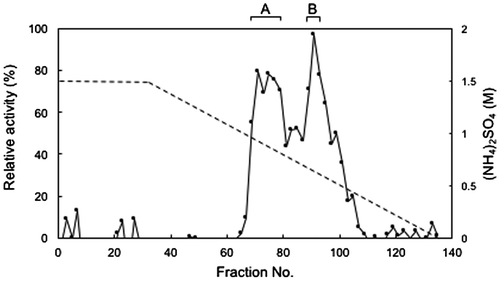
Figure 2. SDS-PAGE of the fractions from hydrophobic interaction chromatography with formaldehyde dismutase activity. Lanes A and B, the representatives of A-fraction and B-fraction, respectively, from Figure 1. Lane M, protein markers. Arrows indicate the molecular weights of bands from the two fractions. Experimental conditions are specified in Materials and methods.
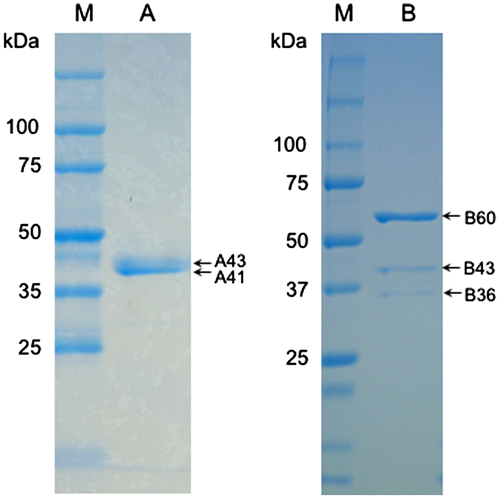
Table 2. NanoLC–MS/MS analysis of the gel bands from SDS-PAGE of the fractions from hydrophobic interaction chromatography with formaldehyde disumutase activity.
Figure 3. Degradation of formaldehyde and production of formic acid and methanol by resting cells of E. coli transformed with the FD1 formaldehyde dismutase gene and decrease in viable cells of the recombinant E. coli. The reaction mixture contained 1 OD-unit/mL of the cells. The solid lines, the recombinant E. coli with pRham-FDM; the dashed line, the recombinant E. coli with pRham (no insert); Closed circles, formaldehyde; closed triangles, formic acid; closed squares, methanol; open circles, viable cells of the recombinant E. coli in the buffer with 0.33 M formaldehyde; open triangles viable cells of the recombinant E. coli in the buffer without formaldehyde. Experimental conditions are specified in Materials and methods. All experiments were performed in triplicates, and the mean ± standard deviation is shown.
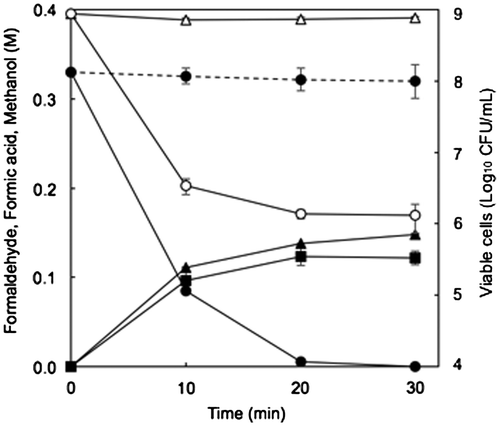
Figure 4. SDS-PAGE of protein extracts and precipitate fractions of E. coli transformed with the formaldehyde dismutase gene of FD1. For all samples, 10 μg of total protein were loaded. Lanes 1–4, the recombinant E. coli with pRham-FDM; lanes 5 and 6, the recombinant E. coli with pRham (no insert); lanes 1, 3, and 5, cell-free protein extracts; lanes 2, 4, and 6, precipitate fractions; lanes 1 and 2, no rhamnose induction; lanes 3, 4, 5, and 6, rhamnose induction. A triangle indicates a specific band. Experimental conditions are specified in Materials and methods.
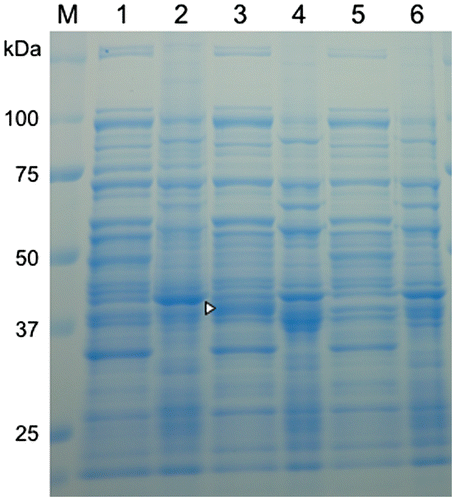
Figure 5 Amino acid alignment of the formaldehyde dismutase of FD1 with (putative) enzymes related to formaldehyde dismutase. The sequences used for the alignment are as follows: MspFD1-FDM, formaldehyde dismutase of Methylobacterium sp. FD1 (accession No. LS269930) in class Alphaproteobacteria; CspSK3-ADM, putative aldehyde dismutase of Cupriavidus sp. SK-3 (WP_051648669) in class Betaproteobacteria; Tbo-ADM, putative aldehyde dismutase of T. bouteillei (WP_038092476) in class Cyanobacteria; MspGXS13-ADM, putative aldehyde dismutase of Methylobacterium sp. GXS13 (WP_058191240) in class Alphaproteobacteria; Pbo-FDH, putative glutathione-independent formaldehyde dehydrogenase of P. borealis (WP_076349806) in class Planctomycetia; Rsp-ADM, putative aldehyde dismutase of Rhodococcus spp. (WP_003943355) in class Actinobacteria; SspTu6071-ADM, putative aldehyde dismutase of Streptomyces sp. Tu6071 (WP_043257889) in class Actinobacteria; Fsp-ADM, putative aldehyde dismutase of Flavobacteriaceae (WP_027374817) in class Flavobacteriia; PpuF61-FDM, formaldehyde dismutase of P. putida F61 (L25862) of Gammaproteobacteria; PpuC83-FDH, glutathione-independent formaldehyde dehydrogenase of P. putida C83 (D21201) of Gammaproteobacteria. Identical residues in all of the (putative) enzymes are indicated by black highlight. Asterisks, the NAD(H)-binding residues; open circles, catalytic zinc-binding residues; closed circles, structural zinc-binding residues of the glutathione-independent formaldehyde dehydrogenase of P. putida C83 [Citation2].
![Figure 5 Amino acid alignment of the formaldehyde dismutase of FD1 with (putative) enzymes related to formaldehyde dismutase. The sequences used for the alignment are as follows: MspFD1-FDM, formaldehyde dismutase of Methylobacterium sp. FD1 (accession No. LS269930) in class Alphaproteobacteria; CspSK3-ADM, putative aldehyde dismutase of Cupriavidus sp. SK-3 (WP_051648669) in class Betaproteobacteria; Tbo-ADM, putative aldehyde dismutase of T. bouteillei (WP_038092476) in class Cyanobacteria; MspGXS13-ADM, putative aldehyde dismutase of Methylobacterium sp. GXS13 (WP_058191240) in class Alphaproteobacteria; Pbo-FDH, putative glutathione-independent formaldehyde dehydrogenase of P. borealis (WP_076349806) in class Planctomycetia; Rsp-ADM, putative aldehyde dismutase of Rhodococcus spp. (WP_003943355) in class Actinobacteria; SspTu6071-ADM, putative aldehyde dismutase of Streptomyces sp. Tu6071 (WP_043257889) in class Actinobacteria; Fsp-ADM, putative aldehyde dismutase of Flavobacteriaceae (WP_027374817) in class Flavobacteriia; PpuF61-FDM, formaldehyde dismutase of P. putida F61 (L25862) of Gammaproteobacteria; PpuC83-FDH, glutathione-independent formaldehyde dehydrogenase of P. putida C83 (D21201) of Gammaproteobacteria. Identical residues in all of the (putative) enzymes are indicated by black highlight. Asterisks, the NAD(H)-binding residues; open circles, catalytic zinc-binding residues; closed circles, structural zinc-binding residues of the glutathione-independent formaldehyde dehydrogenase of P. putida C83 [Citation2].](/cms/asset/f27c29d7-f5a1-4778-abd8-69f4d2f60cc0/tbbb_a_1397497_f0005_b.gif)
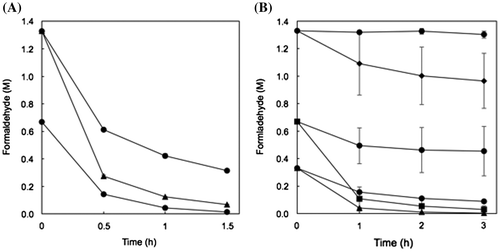
Figure 6. Degradation of high concentrations of formaldehyde by resting and lyophilized cells of E. coli transformed with the formaldehyde dismutase gene of FD1. (A) Resting cells. The reaction mixture contained 1 OD-unit/mL (circles) and 2 OD-units/mL (triangles) of the cells. (B) Lyophilized cells. The reaction mixture contained 1 OD-unit/mL (circles), 2 OD-units/mL (triangles), 5 OD-units/mL (squares), and 10 OD-units/mL (diamonds) of the cells. Experimental conditions are specified in Materials and methods. All experiments were performed in triplicates, and the mean ± standard deviation is shown.
