Figures & data
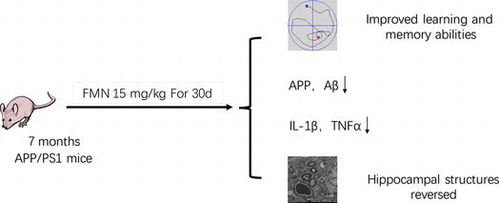
Figure 1. FMN treatment improved spatial learning and memory. APP/PS1 showed significant impairment in spatial learning and memory. Donepezil (positive control) ameliorated the learning and memory deficit. (A) Structure of FMN; (B, C) FMN increased escape latency (F = 4.746, p = 0.012) and swimming length (F = 37.796, p = 0.0001) of APP/PS1 mice measured in MWM; (D) Representative swimming traces of the mice recorded in the maze. Data are presented as mean ± SEM. *p < 0.05 (Bonferroni’s post hoc test for one-way ANOVA).
Figure 2. FMN reduces brain Aβ production in APP/PS1 mice as measured by ELISA. (A) FMN treatment decreased levels of APP, F = 3.556, p = 0.033. (B) FMN treatment decreased levels of Aβ40, F = 7.355, p = 002. (C) FMN treatment decreased levels of Aβ42 in APP/PS1 mice, F = 15.068, p = 0001. Data are presented as mean ± SEM. *p < 0.05 (Bonferroni’s post hoc test for one-way ANOVA).
Figure 3. FMN promotes LRP1-ApoJ pathway, but inhibits RAGE-NF-κB pathway. Representative RT-PCR (A–D), Western blots (E) and quantitative results (F–I) show that FMN increased expression of LRP1and ApoJ pathway, but decreased expression of RAGE and NF-κBp65 in mouse brain homogenates (n = 6 for each genotype) at the age of 8 months. Data are presented as mean ± SEM. *p < 0.05 (Bonferroni’s post hoc test for one-way ANOVA).
Figure 4. FMN reduces IL-1β, IL-6, and TNF-α levels in the brain of APP/PS1 mice. APP/PS1 showed significantly increased levels of IL-1β (A), TNF‑α (B) and IL-6 (C). FMN treatment decreased levels of IL-1β (F = 13.311, p < 0.0001), TNF‑α (F = 13.575, p < 0.0001), and IL-6 (F = 8.338, p = 0.001) in APP/PS1 mice, as measured by ELISA. Data are presented as mean ± SEM. *p < 0.05 (Bonferroni’s post hoc test for one-way ANOVA).
Figure 5. FMN protects hippocampus and BBB against Alzheimer’s like pathology. Pathomorphological changes of hippocampal structure in WT, APP/PS1, donepezil-treated, and FMN-treated mice were examined by transmission electron microscopy (×13000 magnification. BM, basement membrane; E, erythrocyte; m, mitochondrion).