Figures & data
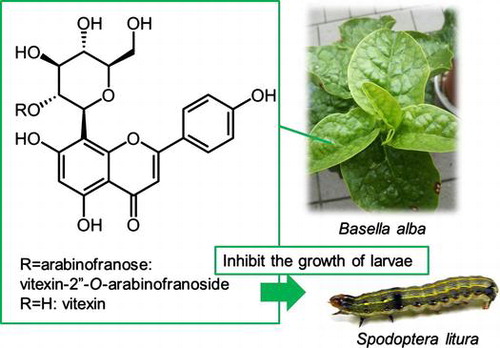
Figure 1. Effects of B. alba leaves on weight gain by S. litura larvae (mean ± SD, n = 13–15). An asterisk below the value indicates a significant difference from the control (spinach leaves) on the same day (p < 0.01 Student’s t-test).
Figure 2. Effects of extracts (A) and flavonoids (B) of B. alba leaves on weight gain by S. litura larvae (mean ± SD, n = 13–15). The concentration of each flavonoid in a piece of leaf was 200 ng/mg. An asterisk next to the value indicates a significant difference from the control (non-treated or ethanol-treated leaves) on the same day (p < 0.01 Student’s t-test).
Figure 3. Typical TIC chromatogram of methanolic extract of B. alba leaves (A). (B) and (C) show extracted ion chromatograms for m/z 565 and 433, respectively.
Figure 4. Structure of vitexin and vitexin (2) and vitexin-2″-O-arabinofranoside (1).
Figure 5. Amounts of vitexin (2) and vitexin-2″-O-arabinofranoside (1) in mature and young leaves (mean ± SEM, n = 5). Differences were analyzed using Student’s t-test.