788
Views
3
CrossRef citations to date
0
Altmetric
Microbiology & Fermentation Technology

CpdA is involved in amino acid metabolism in Shewanella oneidensis MR-1

, &
Pages 166-172 | Received 27 Oct 2017, Accepted 27 Nov 2017, Published online: 13 Dec 2017

Figures & data

Table 1. Bacterial strains and plasmids used in this study.

Figure 1. Growth of S. oneidensis MR-1 and its derivatives in LB and LMM. Growth curves of cells cultured in LB under aerobic conditions are shown in panel A. Growth curves of cells cultured in LMM under aerobic and anaerobic fumarate-reducing conditions are shown in panels B and C, respectively. WT(pBBR1MCS-5), ΔcpdA(pBBR1MCS-5), ΔcpdA (pBBRScpdA), and ΔcpdA (pBBREcpdA) were aerobically grown in LMM containing Gm. Error bars represent standard deviations of means that were calculated from at least triplicate cultures.

Figure 1. Growth of S. oneidensis MR-1 and its derivatives in LB and LMM. Growth curves of cells cultured in LB under aerobic conditions are shown in panel A. Growth curves of cells cultured in LMM under aerobic and anaerobic fumarate-reducing conditions are shown in panels B and C, respectively. WT(pBBR1MCS-5), ΔcpdA(pBBR1MCS-5), ΔcpdA (pBBRScpdA), and ΔcpdA (pBBREcpdA) were aerobically grown in LMM containing Gm. Error bars represent standard deviations of means that were calculated from at least triplicate cultures.

Figure 2. Intracellular cAMP and cGMP levels and growth rates of MR-1 and mutants. cAMP and cGMP levels and growth rates of cells aerobically grown in LMM are shown in panels A, B, and C, respectively. Error bars represent standard deviations of means that were calculated from at least triplicate experiments.

Figure 2. Intracellular cAMP and cGMP levels and growth rates of MR-1 and mutants. cAMP and cGMP levels and growth rates of cells aerobically grown in LMM are shown in panels A, B, and C, respectively. Error bars represent standard deviations of means that were calculated from at least triplicate experiments.
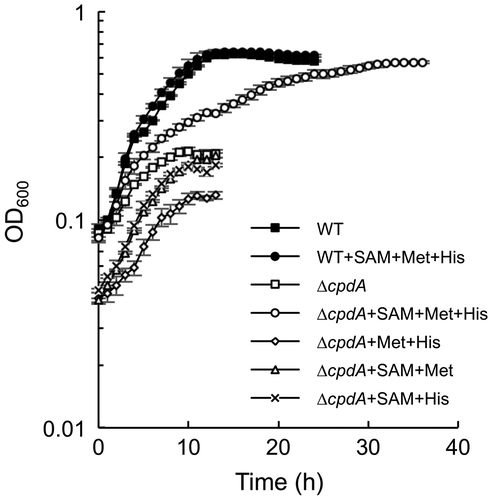
Table 2. Genes involved in methionine, SAM, and histidine synthesis with altered expression in ΔcpdA.

Figure 3. Effects of methionine, SAM, and histidine on the growth of ΔcpdA. Cells were aerobically grown in LMM containing 0.1 mM methionine (Met), 0.1 mM histidine (His), and/or 35 μM SAM. Error bars represent standard deviations of means that were calculated from at least triplicate cultures.

Figure 3. Effects of methionine, SAM, and histidine on the growth of ΔcpdA. Cells were aerobically grown in LMM containing 0.1 mM methionine (Met), 0.1 mM histidine (His), and/or 35 μM SAM. Error bars represent standard deviations of means that were calculated from at least triplicate cultures.
Supplemental material

Supplementary_Table_3.xlsx

Download MS Excel (35.6 KB)

Supplementary_Table_2.xlsx

Download MS Excel (35.3 KB)

Supplementary_Table_1.docx

Download MS Word (122.8 KB)

171014kasai_cpdA_FigS1.pdf

Download PDF (62.2 KB)

Reprints and Corporate Permissions

Please note: Selecting permissions does not provide access to the full text of the article, please see our help page How do I view content?

To request a reprint or corporate permissions for this article, please click on the relevant link below:

Academic Permissions

Please note: Selecting permissions does not provide access to the full text of the article, please see our help page How do I view content?

Obtain permissions instantly via Rightslink by clicking on the button below:

If you are unable to obtain permissions via Rightslink, please complete and submit this Permissions form. For more information, please visit our Permissions help page.