Figures & data
![](/cms/asset/ed842e78-4730-4758-84de-03a51540054a/tbbb_a_1415125_uf0001_oc.jpg)
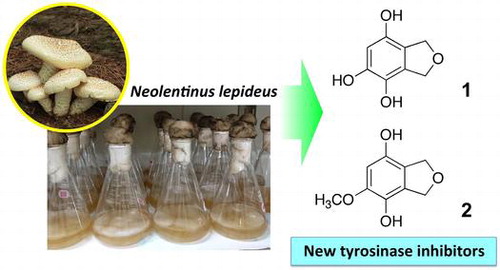
Table 1. 1H (600 MHz) and 13C (150 MHz) NMR data for 1 and 2 in methanol-d4
Figure 1. HMBC and COSY correlations of 1 and 2. Arrows indicates the correlation from protons to carbons observed by HMBC, and bold lines indicate the correlations observed by COSY.
![Figure 1. HMBC and COSY correlations of 1 and 2. Arrows indicates the correlation from protons to carbons observed by HMBC, and bold lines indicate the correlations observed by COSY.](/cms/asset/047e78c9-0675-4143-ac75-4061fa5c47d3/tbbb_a_1415125_f0001_b.gif)
Figure 3. Inhibition of tyrosinase by compound 1 (closed circles), 2 (closed triangles), hydroquinone (open squares), and arbutin (open diamonds).
![Figure 3. Inhibition of tyrosinase by compound 1 (closed circles), 2 (closed triangles), hydroquinone (open squares), and arbutin (open diamonds).](/cms/asset/9acf459f-ee6c-4e57-abfd-110c234e99ab/tbbb_a_1415125_f0003_b.gif)
Figure 4. Lineweaver-Burk plot for the enzyme reactions in the presence of 100 μg/mL (circles) and 300 μg/mL (squares) of 1.
![Figure 4. Lineweaver-Burk plot for the enzyme reactions in the presence of 100 μg/mL (circles) and 300 μg/mL (squares) of 1.](/cms/asset/206ebaa9-7911-4f5f-8460-e430605cf99a/tbbb_a_1415125_f0004_b.gif)
Figure 5. Inhibition of human tyrosinase by 500 μg/mL of 1, 2, arbutin, and hydroquinone. Different letters indicate statistical differences (p < 0.01, Tukey’s multiple comparison test).
![Figure 5. Inhibition of human tyrosinase by 500 μg/mL of 1, 2, arbutin, and hydroquinone. Different letters indicate statistical differences (p < 0.01, Tukey’s multiple comparison test).](/cms/asset/d2ee17a0-171d-4f8d-86ad-320cb5a2ab83/tbbb_a_1415125_f0005_b.gif)
Figure 6. Cytotoxicity of compounds 1 (A) and 2 (B) towards the B16 melanoma cells. The B16 cells were treated for 72 h with varying concentrations of 1 and 2 in the presence of α-MSH, and the number of viable cells was counted with a TC20 cell counter. Data are expressed as mean ± SD (n = 3). Different letters indicate statistical differences (p < 0.05, Tukey’s multiple comparison test). The photographs of harvested cells are shown as insets.
![Figure 6. Cytotoxicity of compounds 1 (A) and 2 (B) towards the B16 melanoma cells. The B16 cells were treated for 72 h with varying concentrations of 1 and 2 in the presence of α-MSH, and the number of viable cells was counted with a TC20 cell counter. Data are expressed as mean ± SD (n = 3). Different letters indicate statistical differences (p < 0.05, Tukey’s multiple comparison test). The photographs of harvested cells are shown as insets.](/cms/asset/66e3c1f5-6fa8-4ee2-83fa-45f9ed466124/tbbb_a_1415125_f0006_oc.gif)
Figure 7. Effects of compounds 1 and 2 on the melanin content of B16 cells. The B16 cells were treated for 72 h with varying concentrations of 1 and 2 in the presence of α-MSH, and melanin contents were determined on the basis of the absorbance at 475 nm for the cell extracts. Data are expressed as mean ± SD (n = 3). Different letters indicate statistical differences (p < 0.05, Tukey’s multiple comparison test).
![Figure 7. Effects of compounds 1 and 2 on the melanin content of B16 cells. The B16 cells were treated for 72 h with varying concentrations of 1 and 2 in the presence of α-MSH, and melanin contents were determined on the basis of the absorbance at 475 nm for the cell extracts. Data are expressed as mean ± SD (n = 3). Different letters indicate statistical differences (p < 0.05, Tukey’s multiple comparison test).](/cms/asset/1f65ea10-5359-4c07-93b7-4731eba26805/tbbb_a_1415125_f0007_b.gif)
Figure 8. Effects of treatment with 1 on the accumulation of transcripts of TYR (A), TRP-1 (B), TRP-2 (C), and MiTF (D), and on the accumulation of TYR, TRP1, TRP2, and MiTF proteins. The B16 cells were treated for 72 h with varying concentrations of 1 in the presence of α-MSH. The transcript levels were determined by quantitative RT-PCR with specific primer sets, and the proteins were detected by western blot analyses.
![Figure 8. Effects of treatment with 1 on the accumulation of transcripts of TYR (A), TRP-1 (B), TRP-2 (C), and MiTF (D), and on the accumulation of TYR, TRP1, TRP2, and MiTF proteins. The B16 cells were treated for 72 h with varying concentrations of 1 in the presence of α-MSH. The transcript levels were determined by quantitative RT-PCR with specific primer sets, and the proteins were detected by western blot analyses.](/cms/asset/0f8f3690-08a8-464e-868e-1f1d27e2144c/tbbb_a_1415125_f0008_oc.gif)