Figures & data
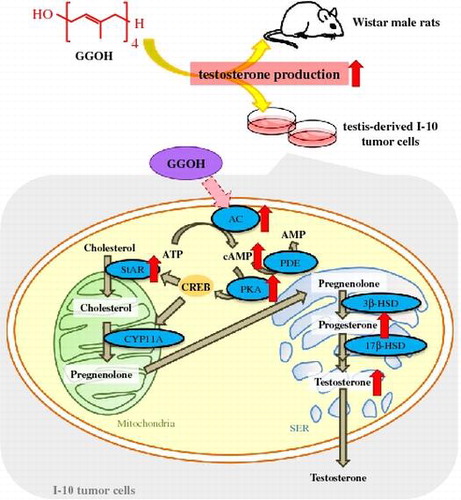
Figure 1. Steroidogenic pathway in testicular Leydig cells. AC, adenylate cyclase; CREB, cAMP response element-binding protein; CYP11A, cholesterol side-chain cleavage enzyme; G, G protein; LH, luteinizing hormone; LHR, LH receptor; Mito, mitochondria; PDE, phosphodiesterase; PKA, protein kinase A; SER, smooth endoplasmic reticulum; StAR, steroidogenic acute regulatory protein.
Figure 2. Testosterone and progesterone levels after GGOH treatment in I-10 cells. Cells were treated with of GGOH for 0–24 h, and testosterone (A) and progesterone (B, C) levels in cultured medium were measured. Data are presented as mean ± SD (n = 3). *p < 0.05, **p < 0.01 vs. 0 μM. Different letters indicate significant differences (p < 0.05). Data for panels A–C were taken from reference [Citation32].
![Figure 2. Testosterone and progesterone levels after GGOH treatment in I-10 cells. Cells were treated with of GGOH for 0–24 h, and testosterone (A) and progesterone (B, C) levels in cultured medium were measured. Data are presented as mean ± SD (n = 3). *p < 0.05, **p < 0.01 vs. 0 μM. Different letters indicate significant differences (p < 0.05). Data for panels A–C were taken from reference [Citation32].](/cms/asset/0e57f7cd-dd0b-433f-9b91-fdab402a1629/tbbb_a_1415129_f0002_b.gif)
Figure 3. GGOH regulates cAMP/PKA signaling pathway by modulating AC activity in I-10 cells. (A) Intracellular cAMP levels were enhanced after GGOH treatment (30 μM) in I-10. (B–D) GGOH (30 μM) stimulated cAMP/PKA signaling pathway via regulation of AC but not PDE activity in I-10 cells. H89: PKA inhibitor, MDL: AC inhibitor, IBMX: PDE inhibitor. (E) Enhanced progesterone production by GGOH (30 μM) was diminished by AC9 siRNA treatment. Data are presented as mean ± SD (n = 3). **p < 0.01 vs. Ctrl group. Different letters indicate significant differences (p < 0.05). Data for panels A–D were reproduced from reference [Citation32].
![Figure 3. GGOH regulates cAMP/PKA signaling pathway by modulating AC activity in I-10 cells. (A) Intracellular cAMP levels were enhanced after GGOH treatment (30 μM) in I-10. (B–D) GGOH (30 μM) stimulated cAMP/PKA signaling pathway via regulation of AC but not PDE activity in I-10 cells. H89: PKA inhibitor, MDL: AC inhibitor, IBMX: PDE inhibitor. (E) Enhanced progesterone production by GGOH (30 μM) was diminished by AC9 siRNA treatment. Data are presented as mean ± SD (n = 3). **p < 0.01 vs. Ctrl group. Different letters indicate significant differences (p < 0.05). Data for panels A–D were reproduced from reference [Citation32].](/cms/asset/bdc6b171-ac09-4b59-a602-bb271f9e637a/tbbb_a_1415129_f0003_b.gif)
Figure 4. Dietary supplementation of GGOH enhances plasma testosterone levels in male Wistar rats. Data are presented as mean ± SD (n = 7 − 8). *p < 0.05 vs. Ctrl group.