522
Views
0
CrossRef citations to date
0
Altmetric
Analytical Chemistry (Note)

A new application for the quantification of apoplastic redox radicals of plant roots using pre-fluorescent probe

, , &
Pages 225-228 | Received 23 Oct 2017, Accepted 17 Dec 2017, Published online: 12 Jan 2018

Figures & data

Figure 1. Synthetic and reaction schemes of the probe. (A) Synthetic scheme of pre-fluorescent probe (1). (B) Reaction scheme of probe (1). (1) was oxidized, then rearranged to (2) and recovered fluorescence. (1) was reduced to (3) and recovered fluorescence. In accordance with the report by Jia and colleagues, compounds (2) and (3) were characterized by LC/MS and their m/z were 395 and 473, respectively.
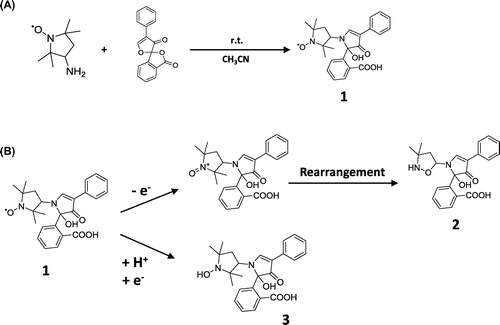
Figure 1. Synthetic and reaction schemes of the probe. (A) Synthetic scheme of pre-fluorescent probe (1). (B) Reaction scheme of probe (1). (1) was oxidized, then rearranged to (2) and recovered fluorescence. (1) was reduced to (3) and recovered fluorescence. In accordance with the report by Jia and colleagues, compounds (2) and (3) were characterized by LC/MS and their m/z were 395 and 473, respectively.

Figure 2. Chromatograms of in vitro reaction solutions using oxidants and reductants. HPLC conditions: column; TSK gel ODS 80-Ts QA (4.6 i.d. ×150 mm), mobile phase; 50 mM sodium acetate buffer (pH 4.0): methanol (2:3, v/v), flow rate; 1.0 mL/min, injection volume; 10 μL, column temperature; 30 °C. Only radical molecules were detected selectively. Reaction with oxidants; hydrogen peroxide and hydroxyl radical (A). Reaction with reductants; sodium ascorbate and glutathione (B).
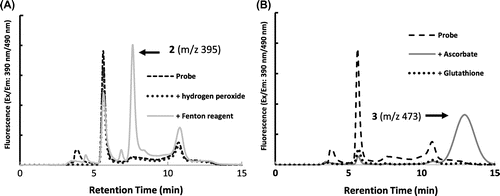
Figure 2. Chromatograms of in vitro reaction solutions using oxidants and reductants. HPLC conditions: column; TSK gel ODS 80-Ts QA (4.6 i.d. ×150 mm), mobile phase; 50 mM sodium acetate buffer (pH 4.0): methanol (2:3, v/v), flow rate; 1.0 mL/min, injection volume; 10 μL, column temperature; 30 °C. Only radical molecules were detected selectively. Reaction with oxidants; hydrogen peroxide and hydroxyl radical (A). Reaction with reductants; sodium ascorbate and glutathione (B).

Figure 3. In vivo apoplastic radical analysis. An oxidative burst triggered by chitin was observed. About two times more radicals were released than by control samples by 60 min. Representative fluorescence chromatograms of the incubating solution with and without chitin (A). Apoplastic radical concentration after 60 min incubation, estimated using the calibration curve. Asterisk indicates a significant difference to control (*p < 0.01, n=3), analyzed by the Student’s t test (B).
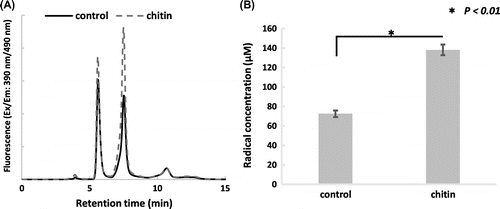
Figure 3. In vivo apoplastic radical analysis. An oxidative burst triggered by chitin was observed. About two times more radicals were released than by control samples by 60 min. Representative fluorescence chromatograms of the incubating solution with and without chitin (A). Apoplastic radical concentration after 60 min incubation, estimated using the calibration curve. Asterisk indicates a significant difference to control (*p < 0.01, n=3), analyzed by the Student’s t test (B).
Supplemental material

Supplemental_data_1.pdf

Download PDF (173.8 KB)

Reprints and Corporate Permissions

Please note: Selecting permissions does not provide access to the full text of the article, please see our help page How do I view content?

To request a reprint or corporate permissions for this article, please click on the relevant link below:

Academic Permissions

Please note: Selecting permissions does not provide access to the full text of the article, please see our help page How do I view content?

Obtain permissions instantly via Rightslink by clicking on the button below:

If you are unable to obtain permissions via Rightslink, please complete and submit this Permissions form. For more information, please visit our Permissions help page.