Figures & data
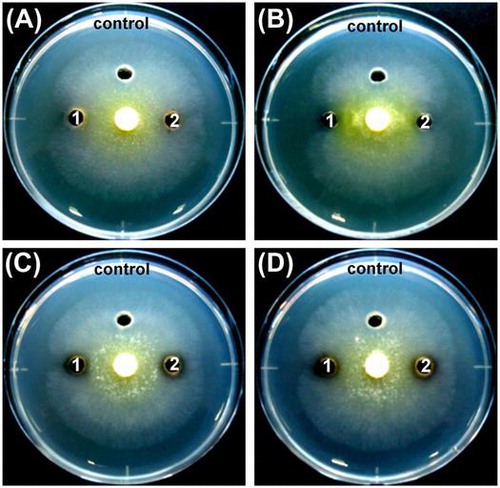
Figure 1. Procedure for sampling and isolation of microorganisms that produce chitinases and form biofilms.
Table 1. Oligonucleotides used in this study.
Figure 2. The clearing zone formed by the isolates and references on the YEM agar plates containing colloidal chitin.
Figure 3. Chitinase activity and biofilm formation of the isolates.
Table 2. Sequence analysis of partial 16S rRNA genes from the isolated strains.
Figure 4. Phylogenetic analysis of the isolates (filled rectangle) based on the 16S rRNA gene sequences.
Figure 5. Time course of chitinase production in the culture supernatant.
Figure 6. SDS–PAGE and zymography analyses of the chitinase production in the culture supernatant.
Figure 7. The antagonistic ability of the isolates against the hyphal growth of T. reesei using the dual-culture assay.
Figure 8. The inhibition of hyphal growth of T. reesei treated by the crude proteins.