587
Views
3
CrossRef citations to date
0
Altmetric
Biochemistry & Molecular Biology

Analysis of the structure and activity of the promoter regions of the metallothionein genes of the freshwater pearl mussel Hyriopsis schlegelii

, , , , , , , , & show all
Pages 780-791 | Received 13 Jul 2017, Accepted 10 Feb 2018, Published online: 02 Mar 2018

Figures & data

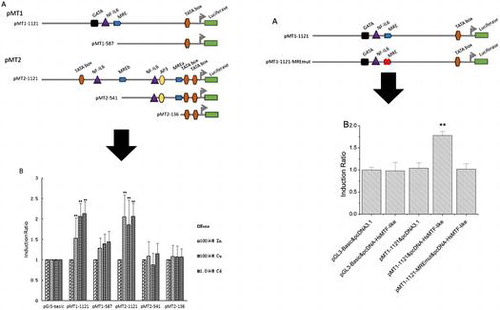
Table 1. Primers used in this study.

Figure 1. Nucleotide sequences of the 5′-upstream regions of the H. schlegelii MT1 (A) (GenBank Accession No. KX279831) and MT2 (B) (GenBank Accession No. KX279832) genes. MREs and other putative transcription factor binding sites are shown.

Figure 1. Nucleotide sequences of the 5′-upstream regions of the H. schlegelii MT1 (A) (GenBank Accession No. KX279831) and MT2 (B) (GenBank Accession No. KX279832) genes. MREs and other putative transcription factor binding sites are shown.

Figure 2. Transcriptional activity of the HsMT1 5′-promoter regions (A) and HsMT2 5′- promoter regions (B) after induction using Zn2+ (50, 100, and 150 μM), Cu2+ (50, 100, and 150 μM), and Cd2+ (0.5, 1.0, and 1.5 μM). The background activity of the pGL3-Basic vector were set as 1.0 and all the other activities were adjusted accordingly. The number on the bars indicates the induction ratio compared with uninduced basal activity. Significant differences across control are indicated with ** at p < 0.05.

Figure 2. Transcriptional activity of the HsMT1 5′-promoter regions (A) and HsMT2 5′- promoter regions (B) after induction using Zn2+ (50, 100, and 150 μM), Cu2+ (50, 100, and 150 μM), and Cd2+ (0.5, 1.0, and 1.5 μM). The background activity of the pGL3-Basic vector were set as 1.0 and all the other activities were adjusted accordingly. The number on the bars indicates the induction ratio compared with uninduced basal activity. Significant differences across control are indicated with ** at p < 0.05.

Figure 3. Transcription activities of each deletion mutants of the HsMT1 and HsMT2 promoters in the presence of 100 μM Zn2+, 100 μM Cu2+, and 1.0 μM Cd2+, respectively. (A) Schematic diagram of the deletion mutants, the main cis-acting elements are marked. (B) Induction ratio of the five deletion mutants in the presence of 100 μM Zn2+, 100 μM Cu2+, and 1.0 μM Cd2+ , calculated by the ratio of the induced promoter activity to the uninduced basal promoter activity. The background activity of the pGL3-Basic vector were set as 1.0 and all the other activities were adjusted accordingly. Significant differences across control are indicated with ** at p < 0.05.

Figure 3. Transcription activities of each deletion mutants of the HsMT1 and HsMT2 promoters in the presence of 100 μM Zn2+, 100 μM Cu2+, and 1.0 μM Cd2+, respectively. (A) Schematic diagram of the deletion mutants, the main cis-acting elements are marked. (B) Induction ratio of the five deletion mutants in the presence of 100 μM Zn2+, 100 μM Cu2+, and 1.0 μM Cd2+ , calculated by the ratio of the induced promoter activity to the uninduced basal promoter activity. The background activity of the pGL3-Basic vector were set as 1.0 and all the other activities were adjusted accordingly. Significant differences across control are indicated with ** at p < 0.05.

Figure 4. Alignment of the deduced amino acid sequences of HsMTF-like and MTF-1s of other species in NCBI. Their GenBank accession numbers are as follows: hMTF: Homo sapiens X78710; zMTF: Danio rerio AF458116; fMTF: Fugu rubripes AJ131393; mMTF: Mus musculus X71327. F1-F6 represent six zinc fingers regions of HsMTF-like. Zinc fingers 1 to 6 are indicated by numbered brackets above the corresponding sequences.

Figure 4. Alignment of the deduced amino acid sequences of HsMTF-like and MTF-1s of other species in NCBI. Their GenBank accession numbers are as follows: hMTF: Homo sapiens X78710; zMTF: Danio rerio AF458116; fMTF: Fugu rubripes AJ131393; mMTF: Mus musculus X71327. F1-F6 represent six zinc fingers regions of HsMTF-like. Zinc fingers 1 to 6 are indicated by numbered brackets above the corresponding sequences.

Figure 5. Effects of HsMTF-like on the promoter activity of HsMT1 in HepG2 cells. (A). Schematic diagram of site-directed mutagenesis of the MRE motif in the HsMT1 and HsMT2 promoters. (B). The cells were co-transfected with promoter reporter plasmids containing a MRE (pMT1-1121) or a site-mutated MRE motif (pMT1-1121-MREmut) together with the HsMTF-like expression vector (pcDNA-HsMTF-like). The cells co-transfected with pGL3-Basic and pcDNA3.1 were used as control and its relative luciferase activities was arbitrarily set to 1.0 and all the other activities were adjusted accordingly. (C & D). HepG2 cells were treated with 100 μM Zn2+ in growth medium when cotransfection of expression vectors (pcDNA3.1 or pcDNA-HsMTF-like) and reporter genes (pMT1-1121, pMT1-1121-MREmut or pMT2-1121). The relative luciferase activity of the samples cotransfected with the pMT1-1121 and pcDNA-HsMTF-like (C) or pcDNA3.1 (D) was arbitrarily set to 1.0 and all the other activities were adjusted accordingly. Each bar represented the mean ± S.D of triplicates. Significant differences across control are indicated with ** at p < 0.05. (E). HepG2 cells were treated with 100 μM Zn2+ in growth medium when cotransfection of expression vectors (pcDNA3.1 or pcDNA-HsMTF-like) and reporter genes (pMT2-1121, pMT2-1121-MREabmut, pMT2-1121-MREamut or pMT2-1121-MREbmut). The relative luciferase activity of the samples cotransfected with the pMT2-1121 and pcDNA3.1 was arbitrarily set to 1.0 and all the other activities were adjusted accordingly. Each bar represented the mean ± S.D of triplicates. Significant differences across control are indicated with ** at p < 0.05.

Figure 5. Effects of HsMTF-like on the promoter activity of HsMT1 in HepG2 cells. (A). Schematic diagram of site-directed mutagenesis of the MRE motif in the HsMT1 and HsMT2 promoters. (B). The cells were co-transfected with promoter reporter plasmids containing a MRE (pMT1-1121) or a site-mutated MRE motif (pMT1-1121-MREmut) together with the HsMTF-like expression vector (pcDNA-HsMTF-like). The cells co-transfected with pGL3-Basic and pcDNA3.1 were used as control and its relative luciferase activities was arbitrarily set to 1.0 and all the other activities were adjusted accordingly. (C & D). HepG2 cells were treated with 100 μM Zn2+ in growth medium when cotransfection of expression vectors (pcDNA3.1 or pcDNA-HsMTF-like) and reporter genes (pMT1-1121, pMT1-1121-MREmut or pMT2-1121). The relative luciferase activity of the samples cotransfected with the pMT1-1121 and pcDNA-HsMTF-like (C) or pcDNA3.1 (D) was arbitrarily set to 1.0 and all the other activities were adjusted accordingly. Each bar represented the mean ± S.D of triplicates. Significant differences across control are indicated with ** at p < 0.05. (E). HepG2 cells were treated with 100 μM Zn2+ in growth medium when cotransfection of expression vectors (pcDNA3.1 or pcDNA-HsMTF-like) and reporter genes (pMT2-1121, pMT2-1121-MREabmut, pMT2-1121-MREamut or pMT2-1121-MREbmut). The relative luciferase activity of the samples cotransfected with the pMT2-1121 and pcDNA3.1 was arbitrarily set to 1.0 and all the other activities were adjusted accordingly. Each bar represented the mean ± S.D of triplicates. Significant differences across control are indicated with ** at p < 0.05.

Reprints and Corporate Permissions

Please note: Selecting permissions does not provide access to the full text of the article, please see our help page How do I view content?

To request a reprint or corporate permissions for this article, please click on the relevant link below:

Academic Permissions

Please note: Selecting permissions does not provide access to the full text of the article, please see our help page How do I view content?

Obtain permissions instantly via Rightslink by clicking on the button below:

If you are unable to obtain permissions via Rightslink, please complete and submit this Permissions form. For more information, please visit our Permissions help page.