Figures & data
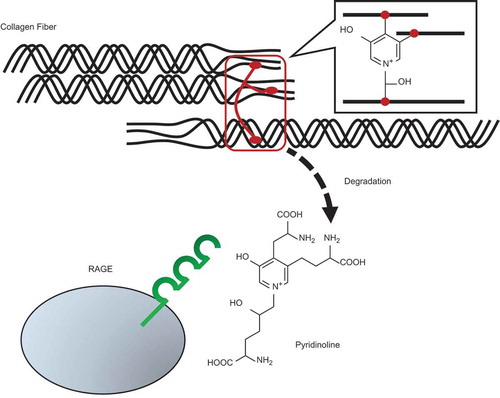
Figure 1. Structure and preparation of Pyr.
(A) Chemical structures of GLAP, GA-pyridine and Pyr. (B) Typical HPLC chromatograms of isolated Pyr monitored for fluorescence (Ex/Em, 295 nm/395 nm) and absorbance at 295 nm. The purified Pyr solution was injected onto an analytical C18 column at a flow rate of 0.8 mL/min using a HPLC system. (C) The UV-Vis spectrum of the purified Pyr analyzed by a photodiode array detector.
Figure 2. Cytotoxicity of Pyr.
Viability of PC12 cells 72 h after treatment with different concentrations of Pyr. Cell viability was assessed by trypan blue exclusion test. Data are expressed as the means ± SE. * represents a significant difference compared with the control (p < 0.05, n = 3), evaluated by Dunnett’s test.
Figure 3. Pyr elicits cytotoxicity to PC12 cells via RAGE.
(a) Effects of the anti-RAGE antibody on the toxicity of Pyr. PC12 cells were treated with the anti-RAGE antibody or its isotype control IgG (50 µg/mL) for 1 h, and then exposed to 5 µM Pyr. Cell viability was assessed by trypan blue exclusion test after 24 h. (B) Effects of the recombinant soluble RAGE protein on the toxicity of Pyr. PC12 cells were exposed to a mixture of purified GST or GST-V (50 µg/mL) and Pyr (5 µM) that had been pre-incubated at room temperature for 30 min. Cell viability was assessed by trypan blue exclusion test after 72 h. Data are expressed as the means ± SE. * represents a significant difference compared with the control (p < 0.05, n = 3), evaluated by Dunnett’s test.
Figure 4. Pyr directly interacts with RAGE.
Binding responses between RAGE and different concentrations of either (A) Pyr or (B) desmosine. Purified GST-sRAGE was covalently immobilized on a CM5 sensor chip to obtain about 15,000 RU using a Biacore system. Each concentration of Pyr (3.8, 7.7, 15.3, 30.7 and 61.3 µM) or desmosine (0.0625, 0.125, 0.25, 0.5 and 1.0 mM) was injected over the flow cells for 60 sec at a flow rate of 30 µL/min. All SPR sensorgrams were compensated by subtracting the response of the reference flow cell.