Figures & data
Figure 1. Reactivity of monoclonal antibody with borate-rhamnogalacturonan II complex (B-RG-II).
A positively charged nylon membrane was spotted with 1 µL of 20 mM Tris-HCl (pH 8.0) containing various amounts of B-RG-II in duplicate, and then subjected to chemiluminescent immunodetection with anti-RG-II antibodies. Monoclonal antibody (42–6), the recombinant rabbit monoclonal antibody produced in this study used at 1 ng/mL; polyclonal rabbit antibody, the antibody previously raised and characterized in our laboratory [Citation14] and used at 2 µg/mL; normal rabbit IgG, immunoglobulin G from unimmunized rabbit used at 2 µg/mL.
![Figure 1. Reactivity of monoclonal antibody with borate-rhamnogalacturonan II complex (B-RG-II).A positively charged nylon membrane was spotted with 1 µL of 20 mM Tris-HCl (pH 8.0) containing various amounts of B-RG-II in duplicate, and then subjected to chemiluminescent immunodetection with anti-RG-II antibodies. Monoclonal antibody (42–6), the recombinant rabbit monoclonal antibody produced in this study used at 1 ng/mL; polyclonal rabbit antibody, the antibody previously raised and characterized in our laboratory [Citation14] and used at 2 µg/mL; normal rabbit IgG, immunoglobulin G from unimmunized rabbit used at 2 µg/mL.](/cms/asset/b6864347-f671-4c41-826c-de2f9d3bded7/tbbb_a_1485479_f0001_b.gif)
Figure 2. Specificity of rabbit monoclonal antibody. Competitive ELISA to examine the reactivity of the 42–6 antibody against various pectic polysaccharides.
Antibody bound to plate wells was quantified using a peroxidase-conjugated secondary antibody and chemiluminescent reagent kit. Shown are representative results from at least four reproducible, independent experiments. A, comparison of the reactivity toward B-RG-II and RG-II monomer. B, examination of reactivity with various pectic polysaccharides.
Table 1. Glycosyl residue composition of polysaccharide in fraction 91.
Figure 3. Examination of antibody reactivity toward pectic fragments generated by pectinase digestion of radish cell walls.
Radish cell walls were digested with pectinase and the digest was applied to a column of DEAE-Sepharose (Cl – form, 16 × 60 mm) equilibrated with column buffer (20 mM Tris-HCl, pH 8.0). After the unbound material was washed with the column buffer, the bound material was eluted using a linear gradient of 0–0.5 M NaCl (0.5 + 0.5 L) in the column buffer. Fractions were assayed for total sugars and 2-keto-3-deoxysugars to generate a chromatogram (A), and fractions containing major peaks (indicated with asterisks) were subjected to competitive ELISA analysis (B).
Figure 4. Thin-layer chromatography separation of acid hydrolysate of polysaccharide in fraction 91.
Lanes GalA, GlcA, Fuc, Rha, and Xyl were spotted with authentic d-galacturonic acid, d-glucuronic acid, l-fucose, l-rhamnose, and d-xylose, respectively. Lane #91 was spotted with acid hydrolysate of the polysaccharide contained in fraction 91 after separation on ion exchange column (). White and black arrowheads denote the spot of d-galacturonic acid and an unidentified substance, respectively.
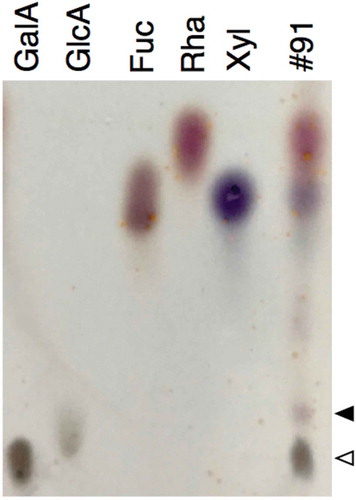
Figure 5. Peak shifts for rhamnogalacturonan II (RG-II) and antibody reactivity.
Borate-RG-II complex without (a) or with (b) acid treatment was separated on a DEAE-Sepharose column (10 × 100 mm), and the fractions were subjected to total sugar analysis for RG-II and competitive ELISA for antibody reactivity. For the antibody reactivity, the decrease in absorbance at 450 nm (∆A450) caused by the addition of each fraction was plotted.
Figure 6. Immunogold labeling of rhamnogalacturonan II in dividing cells in Arabidopsis roots.
(a–c) Section incubated with the 42–6 primary and gold-conjugated secondary antibodies. (d) Section incubated with normal rabbit immunoglobulin and gold-conjugated secondary antibody. (b) and (c) are higher magnifications of squares drawn in the left and middle part in (a), respectively. Arrows in (b) and (c) show representative gold particles. Larger and less defined dots are ribosomes. A line in the upper-right corner in (a), as indicated by the asterisk, is an artificial scratch generated during the section preparation. cp, cell plates; cw, cell walls. Bar = 1 μm.
Figure 7. Quantification of the 42–6 antibody immunogold labeling density.
Boxplot representing the number of gold particles per square micrometer after immunogold labeling of rhamnogalacturonan II in longitudinal and transverse cell walls. Gold particles were counted in 20 micrograph images for each direction and divided by the area measured using the ImageJ software [Citation23]. The micrographs used represent 17 independent cells from three seedlings. Box encompasses the 25–75 percentiles with the solid line indicating the median. Whiskers show the 10–90 percentiles.
![Figure 7. Quantification of the 42–6 antibody immunogold labeling density.Boxplot representing the number of gold particles per square micrometer after immunogold labeling of rhamnogalacturonan II in longitudinal and transverse cell walls. Gold particles were counted in 20 micrograph images for each direction and divided by the area measured using the ImageJ software [Citation23]. The micrographs used represent 17 independent cells from three seedlings. Box encompasses the 25–75 percentiles with the solid line indicating the median. Whiskers show the 10–90 percentiles.](/cms/asset/5b5450fc-4aa3-4dee-a484-0b89f49cdd23/tbbb_a_1485479_f0007_b.gif)
Figure 8. Immunogold labeling of rhamnogalacturonan II in root cells at an earlier stage of cell division.
(a) A dividing cell with a developing cell plate, which is presumably at the tubular network stage (white arrowhead). (b) Higher magnifications of the square in (a). Arrows in (b) show representative gold particles. cp, cell plate. Bar = 1 μm.