
Figures & data
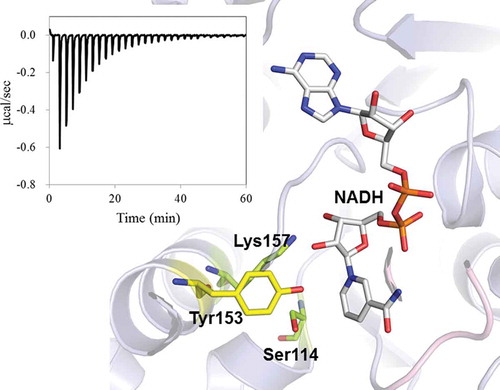
Table 1. The primer sequences for Ps3aHSD using PCR.
Figure 1. Secondary structure analysis. Far-UV CD spectra of wild-type Ps3αHSD and its mutants, S114A, Y153F, K157A, and S114A/Y153F, are superimposed.
Table 2. Steady-state kinetic constants for Ps3αHSD and its mutants with steroids.
Table 3. Thermodynamic parameters for interactions of NADH with Ps3αHSD and its mutants.
Figure 2. ITC profiles for the binding of NADH to wild-type Ps3αHSD and its mutants. NADH solution was injected into the solution of the wild-type, S114A, Y153F, and K157A.
Figure 3. Relative positions of catalytic residues, Ser114, Tyr153, and Lys157, and NADH in the crystal structure of Ps3αHSD [Citation8]. The distances are indicated as the unit of Å. The image was generated using the program PyMol (http://www.pymol.org/).
![Figure 3. Relative positions of catalytic residues, Ser114, Tyr153, and Lys157, and NADH in the crystal structure of Ps3αHSD [Citation8]. The distances are indicated as the unit of Å. The image was generated using the program PyMol (http://www.pymol.org/).](/cms/asset/6cf0d801-d789-4033-b523-4b550c1b4666/tbbb_a_1486175_f0003_oc.jpg)