423
Views
4
CrossRef citations to date
0
Altmetric
Biochemistry & Molecular Biology

MicroRNA-141-3p/200a-3p target and may be involved in post-transcriptional repression of RNA decapping enzyme Dcp2 during renal development

, , &
Pages 1724-1732 | Received 14 Mar 2018, Accepted 28 May 2018, Published online: 18 Jun 2018

Figures & data

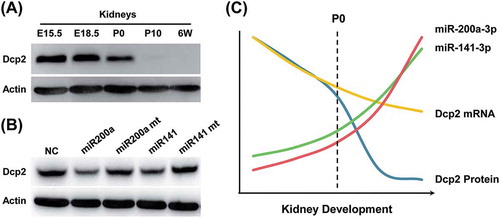
Table 1. Primers used for qPCR and plasmids construction.

Figure 1. Dcp2 protein and mRNA expression during renal development in mice. (A) Dcp2 protein expression in kidneys at the indicated developmental stages was determined by Western blot. β-actin was used for normalization. (B) Quantification of Dcp2 protein expression. Dcp2 mRNA levels during renal development were determined by qPCR and normalized to (C) β-actin and (D) 18S rRNA. Results are shown as mean ± SD and all experiments were performed in triplicate. 6W, postnatal week 6.

Figure 1. Dcp2 protein and mRNA expression during renal development in mice. (A) Dcp2 protein expression in kidneys at the indicated developmental stages was determined by Western blot. β-actin was used for normalization. (B) Quantification of Dcp2 protein expression. Dcp2 mRNA levels during renal development were determined by qPCR and normalized to (C) β-actin and (D) 18S rRNA. Results are shown as mean ± SD and all experiments were performed in triplicate. 6W, postnatal week 6.

Figure 2. Dcp2 mRNA is not silenced in kidneys of adult mice. (A) Schematic representation of the Dcp2-IRES-EGFP knock-in strategy using CRISPR/Cas9. (B) Genotyping of Dcp2-IRES-EGFP mice using primers indicated in (A). (C) Dcp2 and EGFP protein expression in kidneys and testes of 6-week-old mice was determined by Western blot. β-actin was used for normalization. WT, wild type; KI, EGFP knock-in.

Figure 2. Dcp2 mRNA is not silenced in kidneys of adult mice. (A) Schematic representation of the Dcp2-IRES-EGFP knock-in strategy using CRISPR/Cas9. (B) Genotyping of Dcp2-IRES-EGFP mice using primers indicated in (A). (C) Dcp2 and EGFP protein expression in kidneys and testes of 6-week-old mice was determined by Western blot. β-actin was used for normalization. WT, wild type; KI, EGFP knock-in.

Figure 3. Luciferase reporter assays show that miR-141-3p and miR-200a-3p target the 3ʹ UTR of Dcp2. (A) Schematic representation of the highly conserved binding site (top) and the less conserved site (bottom) of miR-141-3p and miR-200a-3p in the Dcp2 3ʹ UTR of different species. Potential sequences base-pairing with miRNA seed regions are shown in grey. Mutations inserted into the seed regions of miRNAs are underlined and shown on the top with miR-200a-3p as representative. (B) Wild type, but not mutant, miR-141-3p and miR-200a-3p inhibit activity of the Luc-5ʹ-half reporter when cotransfected into HEK293T cells. (C) miR-141-3p and miR-200a-3p do not inhibit activity of the Luc-3ʹ-half reporter in dual luciferase assay experiments. Results are shown as mean ± SD and all luciferase experiments were performed in triplicate. P values of Student’s t-tests are indicated by asterisks. * < 0.05. ** < 0.01. NC, negative control miRNA.

Figure 3. Luciferase reporter assays show that miR-141-3p and miR-200a-3p target the 3ʹ UTR of Dcp2. (A) Schematic representation of the highly conserved binding site (top) and the less conserved site (bottom) of miR-141-3p and miR-200a-3p in the Dcp2 3ʹ UTR of different species. Potential sequences base-pairing with miRNA seed regions are shown in grey. Mutations inserted into the seed regions of miRNAs are underlined and shown on the top with miR-200a-3p as representative. (B) Wild type, but not mutant, miR-141-3p and miR-200a-3p inhibit activity of the Luc-5ʹ-half reporter when cotransfected into HEK293T cells. (C) miR-141-3p and miR-200a-3p do not inhibit activity of the Luc-3ʹ-half reporter in dual luciferase assay experiments. Results are shown as mean ± SD and all luciferase experiments were performed in triplicate. P values of Student’s t-tests are indicated by asterisks. * P < 0.05. ** P < 0.01. NC, negative control miRNA.

Figure 4. Overexpression of miR-141-3p and miR-200a-3p downregulates endogenous Dcp2 protein expression but do not affect Dcp2 mRNA levels in NIH3T3 cells. (A) Wild type and mutant miR-141-3p and miR-200a-3p were transfected into NIH3T3 cells. After 48 h, Dcp2 protein levels were measured by Western blot. β-actin was used for normalization. Experiments were performed in triplicate. A representative image is shown in the top panel. (B) Quantification of Dcp2 protein expression. Data are shown as mean ± SD. P values of Student’s t-tests are indicated by asterisks. * < 0.05. ** < 0.01. (C) Wild type and mutant miR-141-3p and miR-200a-3p were transfected into NIH3T3 cells and Dcp2 mRNA levels were determined by qPCR with β-actin as internal control. Data are shown as mean ± SD.

Figure 4. Overexpression of miR-141-3p and miR-200a-3p downregulates endogenous Dcp2 protein expression but do not affect Dcp2 mRNA levels in NIH3T3 cells. (A) Wild type and mutant miR-141-3p and miR-200a-3p were transfected into NIH3T3 cells. After 48 h, Dcp2 protein levels were measured by Western blot. β-actin was used for normalization. Experiments were performed in triplicate. A representative image is shown in the top panel. (B) Quantification of Dcp2 protein expression. Data are shown as mean ± SD. P values of Student’s t-tests are indicated by asterisks. * P < 0.05. ** P < 0.01. (C) Wild type and mutant miR-141-3p and miR-200a-3p were transfected into NIH3T3 cells and Dcp2 mRNA levels were determined by qPCR with β-actin as internal control. Data are shown as mean ± SD.

Figure 5. MiR-141-3p and miR-200a-3p expression increases significantly during renal development. qPCR was used to measure (A) miR-141-3p and (B) miR-200a-3p levels at different stages of kidney development. The results were normalized to U6 snRNA expression. The expression level at E15.5 was set to 1. Data are shown as mean ± SD and all experiments were performed in triplicate.

Figure 5. MiR-141-3p and miR-200a-3p expression increases significantly during renal development. qPCR was used to measure (A) miR-141-3p and (B) miR-200a-3p levels at different stages of kidney development. The results were normalized to U6 snRNA expression. The expression level at E15.5 was set to 1. Data are shown as mean ± SD and all experiments were performed in triplicate.

Reprints and Corporate Permissions

Please note: Selecting permissions does not provide access to the full text of the article, please see our help page How do I view content?

To request a reprint or corporate permissions for this article, please click on the relevant link below:

Academic Permissions

Please note: Selecting permissions does not provide access to the full text of the article, please see our help page How do I view content?

Obtain permissions instantly via Rightslink by clicking on the button below:

If you are unable to obtain permissions via Rightslink, please complete and submit this Permissions form. For more information, please visit our Permissions help page.