Figures & data
Figure 1. Quantitative analysis of penetration resistance to Pyricularia oryzae in Arabidopsis mutant plants.Mean frequency of P. oryzae penetration into Arabidopsis mutant plants at 72 hours post-inoculation (hpi) expressed as percentage of the total number of infection sites. Values are presented as mean ± standard error, n = 3 independent experiments. Bars with the same lowercase letters are not statistically significantly different (p > 0.05).
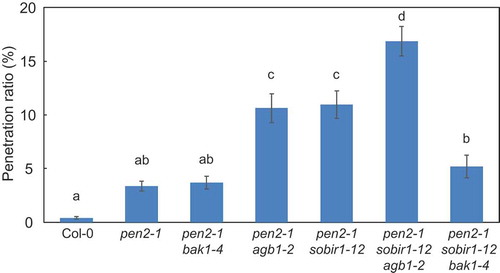
Figure 2. Quantitative analysis of post-penetration resistance to P. oryzae in Arabidopsis mutant plants.
Mean lengths of infection hyphae were measured at 72 hpi. Values are presented as mean ± standard error, n = 3 independent experiments. Bars with the same lowercase letters are not statistically significantly different (p > 0.05).
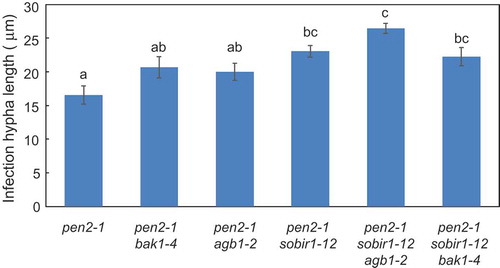
Figure 3. Quantitative analysis of number of hyphal branches of P. oryzae in Arabidopsis mutant plants.
Number of P. oryzae hyphal branches of P. oryzae was measured at 72 hpi. Values are presented as mean ± standard error, n = 3 independent experiments. Bars with the same lowercase letters are not statistically significantly different (p > 0.05).
Figure 4. Quantitative analysis of Arabidopsis mutant plant height.
Plant height was measured in 4-month-old Arabidopsis mutant plants for at least 30 plants per genotype. Values are presented as mean ± standard error, n = 3 independent experiments. Bars with the same lowercase letters are not statistically significantly different (p > 0.05).
Figure 5. Quantitative analysis of penetration resistance to P. oryzae in Arabidopsis mutant plants.
Mean frequency of P. oryzae penetration into Arabidopsis mutant plants at 72 hpi expressed as percentage of total number of infection sites. Values are presented as mean ± standard error, n = 3 independent experiments. Bars with the same lowercase letters are not statistically significantly different (p > 0.05).
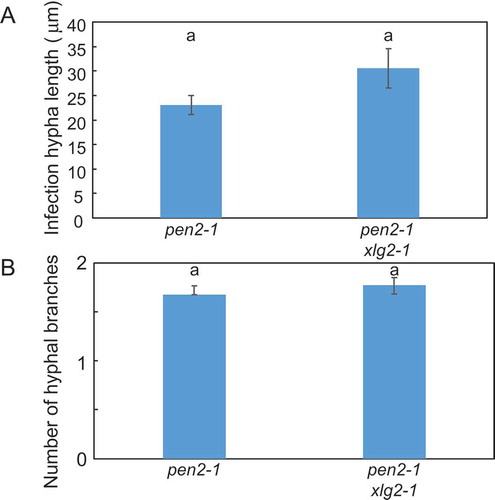
Figure 6. Quantitative analysis of post-penetration resistance to P. oryzae in pen2-1 xlg2-1 mutant plants.
A, Mean lengths of infection hyphae measured at 72 hpi. Values are presented as mean ± standard error, n = 3 independent experiments. Bars with the same lowercase letters are not statistically significantly different (p > 0.05).B, Number of P. oryzae hyphal branches at 72 hpi. Values are presented as mean ± standard error, n = 3 independent experiments. Bars with the same lowercase letters are not statistically significantly different (p > 0.05).