Figures & data
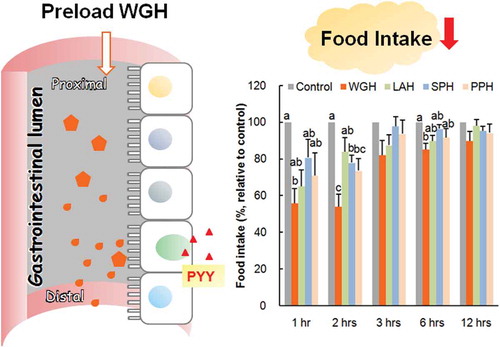
Figure 1. The effect of orogastric preload of various protein hydrolysates on food intake in re-fed rats.
The diet was given immediately after the oral administration of wheat gluten hydrolysate (WGH), lactalbumin enzymatic hydrolysate (LAH), soybean protein hydrolysate (SPH) or potato protein hydrolysate (PPH) at a dose of 1.0 g/kg BW. The administration of water (6 mL/kg BW) was the control. The accumulated food intake was measured at 1, 2, 3, 6, and 12 h after feeding. The food intake relative to the control (considered to be 100%) is presented. The results are expressed as the mean ± SEM (numbers of rats for water, WGH, LAH, SPH, and PPH treatments are 11, 8, 9, 11, and 10, respectively). The two-way repeated measure ANOVA P values are 0.0015, < 0.0001, < 0.0001 for treatment, time, and treatment × time, respectively. Bars not sharing the same letters differ significantly (P < 0.05 by Tukey-Kramer test) at the same time points.
Figure 2. Comparison of satiety effect between WGH and LAH in re-fed rats.
The accumulated food intake was measured after the oral administration of 0.5–1.5 g/kg BW WGH (a) or LAH (b). The food intake relative to the control (considered to be 100%) is presented. The results are expressed as the mean ± SEM (numbers of rats for water, 0.5 g/kg WGH, 1.0 g/kg WGH, 1.5 g/kg WGH, 0.5 g/kg LAH, 1.0 g/kg LAH, 1.5 g/kg LAH treatments are 21, 19, 18, 19, 17, 20, and 20, respectively). The respective two-way repeated measure ANOVA P values for WGH (a) are < 0.0001, < 0.0001, 0.0422 for treatment, time, and treatment × time; the values for LAH (b) are < 0.0001, < 0.0001, 0.0015 for treatment, time, and treatment × time. (c) The accumulated food intake was measured after a single oral administration of 1.0 g/kg BW WGH or LAH (not cross-over design). The results are expressed as the mean ± SEM (numbers of rats for water, WGH, and LAH treatments are 8, 5, and 6, respectively). The two-way repeated measure ANOVA P values for accumulated food intake are < 0.0001, 0.0026, 0.0977 for treatment, time, and treatment × time, respectively. Bars not sharing the same letters differ significantly (P < 0.05 by Tukey-Kramer test) at the same time points.
Figure 3. The effect of orogastric preload of WGH or intact wheat gluten on food intake in re-fed rats.
The accumulated food intake was measured after the oral administration of 1.0 g/kg BW WGH or WG (intact wheat gluten). The food intake relative to the control (considered to be 100%) is presented. The results are expressed as the mean ± SEM (numbers of rats for water, WGH, and WG treatments are 20, 19, and 18, respectively). The two-way repeated measure ANOVA P values are < 0.0001, 0.0019, 0.1344 for treatment, time, and treatment × time, respectively. Bars not sharing the same letters differ significantly (P < 0.05 by Tukey-Kramer test) at the same time points.
Table 1. The effect of orogastric preload of WGH or LAH on postprandial gut hormone levels in portal vein in rats (pM).
Figure 4. CCK and GLP-1 secretion in response to WGH or LAH in enteroendocrine cells.
(a) The CCK levels were measured in the supernatants of STC-1 cells after exposure to the test hydrolysates (WGH or LAH) at 5–10 mg/mL for 1 h. (b) The GLP-1 levels were measured in the supernatants of GLUTag cells after exposure to the test hydrolysates (WGH or LAH) at 5–10 mg/mL for 1 h. The level relative to the blank (considered to be 100%) is presented. The results are expressed as the mean ± SEM of three to seven wells. Bars not sharing the same letters differ significantly (P < 0.05 by Tukey-Kramer test).
Figure 5. The effects of in vitro digestion of WGH or LAH on GLP-1 secretion in GLUTag cells.
WGH or LAH was treated with pepsin and pancreatin for various time periods indicated below the X-axis. The GLUTag cells were exposed to the digested hydrolysates at 10 mg/mL for 1 h, and GLP-1 levels relative to the blank (considered to be 100%) are presented. The results are expressed as the mean ± SEM of three to four wells. Bars not sharing the same letters differ significantly (P < 0.05 by Tukey-Kramer test).