Figures & data
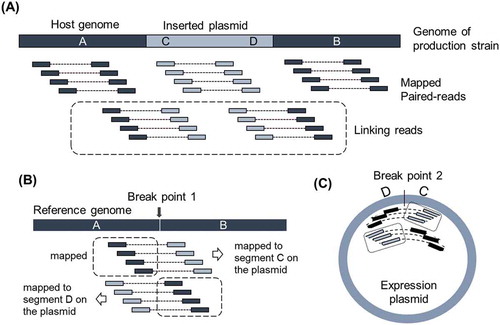
Figure 1. Idea of identification of breakpoints with linking reads.
(A) Illustration of Pool of other than linking reads to the genome of production strain. Pool of linking reads is defined as the paired read of which one read is from host genome and the other read is from inserted expression plasmid. Thick bar illustrates the genome of production strain around the integration site. A and B are flanking regions of inserted plasmid originated from the host genome. C and D indicate the regions around the edges of inserted expression plasmid. (B) Idea of identification of breakpoint on the host genome by mapping Pool of linking reads to the reference genome. (C) Idea of identification of breakpoint on expression plasmid. Illustration was made assuming the inserted plasmid as a single copy.
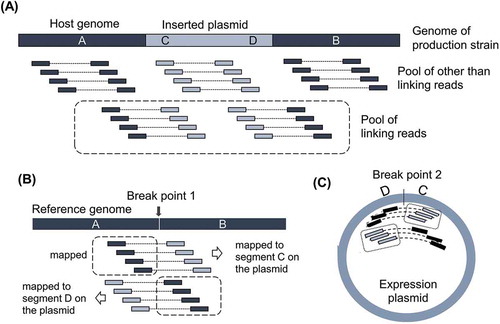
Table 1. Analysis of reads from Illumina paired-end library.
Table 2. Loci on the reference genome where linking reads were mapped to.
Figure 2. View on GiNeS around the inserted locus of the expression plasmid pCaHj621.
Mapping results of four different pools, 1)~4), toward the reference A. oryzae RIB40 are shown. Pink bars represent depth of coverage of reads at each base position. Genes show the annotated CDS in DOGAN and arrows in parenthesis indicate the direction of CDS. What is shown in GiNeS is explained in more detail in the supplemental Figure S2. A cluster of linking reads unique to NZ-A is indicated by a circle in broken line. Predicted integration locus of the expression plasmid pCaHj621 is shown with red arrows. It was close to the 5ʹ end of gene AO09005001483 on chromosome 1. Linking reads from NZ-S were not mapped to this locus.
Figure 3. Detected breakpoints and mapped reads.
(A) View of the mapped linking reads from NZ-A around the predicted integration locus. Identified breakpoint is shown with arrow. Sequences shown in green match to the reference genome sequence, while mismatched bases are shown in red. Direction of mapped reads, indicated by (+) or (-) in blue boxes, become opposite on the upper half and the lower half of mapped reads. (B) Illustration of mapped linking reads shown in (A). (C) View of the mapped reads from the pool of NZ-A without linking reads. Identified breakpoint is shown with arrow. Sequences shown in green match to the reference genome sequence. Sequences of soft-clipped portion of mapped reads correspond to the sequence of the expression plasmid. Direction of the mapped reads become opposite on the upper half and the lower half of mapped reads. (D) Illustration of mapped reads shown in (C). Magnified figures of (A) and (C) are available in Supplemental Data.
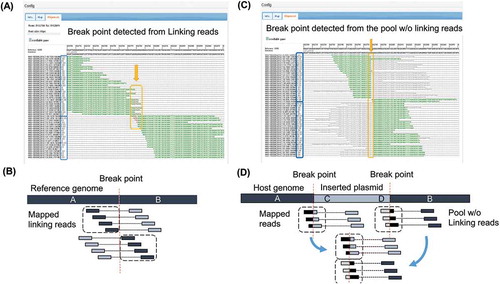
Figure 4. Identified inserted locus of pCaHj621 and structure of integrated plasmid.
The breakpoints at host genome and the edges of insert are shown with the position numbers from the references. Deletion of three bases was observed at the inserted locus on the host genome. One of the edges of integrated plasmid at 230 was in the promoter region of the expression cassette for asparaginase. Another edge at 3803 was in the middle of marker gene, amdS. As at least one functional set of expression plasmid is necessary, it was predicted that the expression plasmid pCaHj621 was integrated as multiple copies in tandem form. Southern blotting analysis revealed that the strain carried 8 copies of pCaHj621.
Figure 5. Identified inserted locus of pMT2155 and illustration of integrated plasmid.
The breakpoints at the host genome were shown with the position number of reference genome. 4-kb long fragment was deleted between breakpoints. One of the edges of inserted plasmid pMT2155, at 2237, was determined by genome sequencing. It was within the terminator region of expression cassette of xylanase gene. Another edge, at 3525, was identified by PCR cloning. It was around 5ʹ-end of amdS. Southern blotting analysis indicated around 30 copies of plasmid was integrated in tandem form. However, directions of the integrated plasmid at both edges were opposite, that indicated the rearrangement occurred in the insert. Further structure of the insert is not known.