
Figures & data
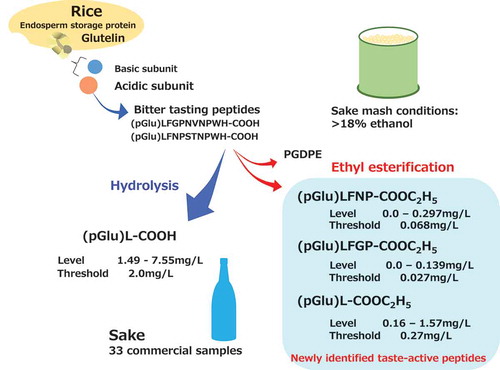
Table 1. MS/MS analysis of precursor ion signals in HPLC fraction and synthesized pyroglutamyl oligopeptide ethyl esters.
Figure 1. HPLC fractionation and MS analysis of pyroglutamyl oligopeptide ethyl esters. (A): daiginjo-shu. (B): ordinary-type sake. Analyzed m/z signals were those observed in the preliminary analysis of the synthesized peptides.
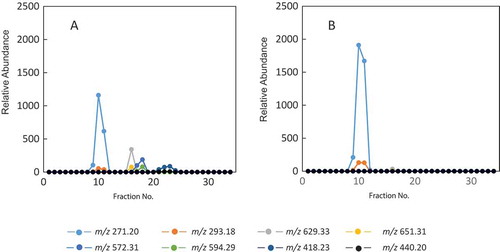
Table 2. Verification data of quantitation.
Table 3. Groups of analyzed sake samples.
Table 4. Best estimated difference threshold (BET) values and their range values in the model sake solution.
Figure 2. MS charts in the quantitation of sake samples. (A): negative mode analysis for non-esterified pyroglutamyl peptides. (B): positive mode analysis for pyroglutamyl oligopeptide ethyl esters.
Figure 3. Quantitated levels of pyroglutamyl oligopeptides in sake samples from each group.
(A): dipeptides ■; (pGlu)L, □; (pGlu)L-ethyl(B): pentapeptides ■; (pGlu)LFGP-ethyl, □; (pGlu)LFNP-ethylData are means and S.D. for each sample group. “nd”: peptide was not detected.
Figure 4. Effects of charcoal treatment on the concentrations of pyroglutamyl oligopeptides in the sake sample. The percentage value of the residual to original is shown. Data are means and S.D. of three MS determinations.
Table 5. Taste characteristics of tested pyroglutamyl oligopeptides in the model sake solution.