Figures & data
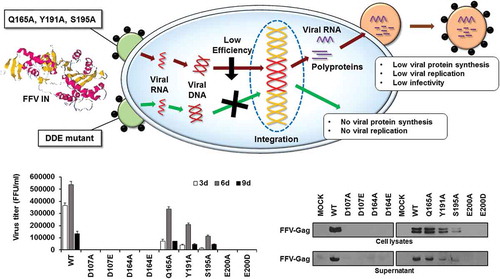
Figure 1. Design of FFV IN mutant. (a) Schematic illustration of the FFV genome based on the pro-viral clone pCF-7. (b) Amino acid alignment of CCD regions of HIV-1 IN, PFV IN, and FFV IN. HIV-1 IN sequence (upper) and FFV IN sequence (lower) were obtained from GenBank code accession numbers NC_001802 and CAD92796.1, respectively. PFV IN sequence (middle) is from protein database (PDB) code 3OY9. The six selected amino acid positions of FFV IN are marked with red letter; D107, D164, Q165, Y191, S195, and E200. The symbols denote the degree of conservation: *, identical;:, conservative; ., semi-conservative; blank, non-conservative.
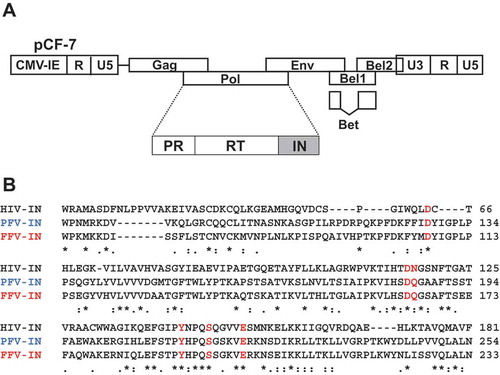
Figure 2. Significant reduction in the enzymatic activities by mutation of CCD residues in FFV IN. (a) 3′-end processing, strand transfer, and disintegration activities of mutant INs are presented as percentages of WT activity. Data are represented as mean ± SEM of three independent triplicate experiments (n = 9). The reaction products were quantitated with a Cyclone Molecular Dynamic PhosphoImager (PerkinElmer). (b) 3′-end processing reactions of mutant INs using FFV U5-mimicking 20/20mer oligonucleotide substrate. Conversion of the 20-mer oligonucleotide substrates to the 18-mer oligonucleotide products was analyzed in a 15% polyacrylamide gel. (c) Strand transfer reaction of mutant INs on FFV U5-mimicking 18/20mer oligonucleotide substrate. The strand transfer products appeared as 18 + n mer and were analyzed in a 15% polyacrylamide gel. (d) Disintegration reaction of mutant INs on Y-shaping FFV U5 oligonucleotide substrate. Production of the 30-mer oligonucleotides were analyzed in a 15% polyacrylamide gel.
Figure 3. Comparison of virus production between COS-1 cell and CRFK cell. Virus titer was detected in the supernatant of FFV transfection and infection experiments. Viral production caused by 5.8 μg DNA transfection or by an infectivity of 0.1 MOI in COS-1 and CRFK cells at 3 days post-transfection or post-infection, respectively. Data represent mean ± SEM of two independent triplicate experiments (n = 6).
Figure 4. Viral production and infectivity by transfection. (a) Viral production in COS-1 cells by transfection. The cells were transfected with WT and mutant viral DNAs. The culture supernatants were collected at 3 days post-transfection, and virus titers were measured by the FeFAB assay. All data are representative of three independent experiments with triplicate samples in the FeFAB assay. Each bar represents mean ± SEM. (b) Western blot analysis of FFV-Gag protein in the transfected cells. Viral Gag proteins were detected with anti FFV-Gag antibody in the cell lysates and supernatant at 3 days post-transfection. β-actin as the loading control (antibody: Thermo Scientific, Waltham, MA, USA) was detected in the cell lysates.
Figure 5. Viral production and infectivity by infection. (a) Viral production and infectivity study by infection. CRFK cells were infected with same volumes of the 3 days post-transfection culture supernatant of WT and each mutant virus. The culture supernatants were harvested at 3, 6, and 9 days post-infection, and virus titers were measured by the FeFAB assay. All data are representative of three independent experiments with triplicate samples in the FeFAB assay. Each bar represents mean ± SEM. (b) Western blot analysis of FFV-Gag protein in the infected cells. Viral Gag proteins were detected with anti FFV-Gag antibody from cell lysates and supernatant at 6 days post-infection.
Figure 6. Analysis of viral DNA integrated into the host chromosomal DNA. (a) Competitive PCR to detect the integrated viral DNA in the chromosomal DNA of the WT virus- and mutant virus-infected cells. CRFK cells were infected with FFV WT, Q165A, Y191A, and S195A mutant viruses by using 3 days post-transfection culture supernatants of same volume, respectively (about 0.1 MOI as WT basis). At 24 and 48 h post-infection, the infected cells were lysed. Chromosomal DNAs were isolated and quantitated. M, DNA marker (0.5, 1, 1.6, 2, 3, 4, 5, 6, 8, 10 kb from the bottom of the gel); pCF-7, pCF-7 only-added as a positive control for full-length FFV IN DNA (1,149bp); Δstu-Ι FIN, Δstu-Ι FIN only added as a positive control for amplification of deleted FFV IN DNA (864bp); MOCK, chromosomal DNA extracted from uninfected CRFK cells; DNA extract, extracted chromosomal DNA added as a target template at 100 ng; DNA extract +Δstu-Ι FIN and Δstu-Ι FIN 10−2–10−9, Δstu-Ι FIN DNA added at 10-fold serial dilutions for competitive PCR reaction. (b) Failure to detect viral DNA in the chromosomal DNA of the D107A, D164E, and E200D virus-infected cells. CRFK cells were infected with the 3 days post-transfection culture supernatant of D107A, D164E, and E200D, with volume of the culture supernatants used for infection being equal to that of WT infection. At 24 and 48 h post-infection, chromosomal DNAs were prepared as mentioned above. To detect viral DNA integrated into chromosomal DNA, PCR amplification was performed using the extracted chromosomal DNA of various amounts (100–1000 ng) as the template DNA.