Figures & data
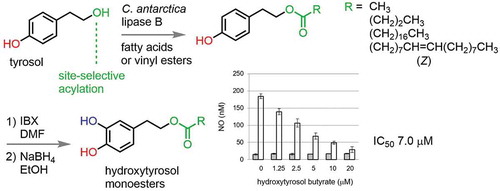
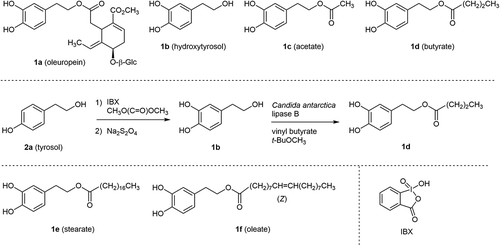
Scheme 1. Catechols involved in olives 1a and 1b, examples of fatty acid monoesters 1c to 1f derived from 1a, and the previous synthesis of 1d.
Scheme 2. Chemoenzymatic synthesis of 1c - f starting from readily available tyrosol 2a.
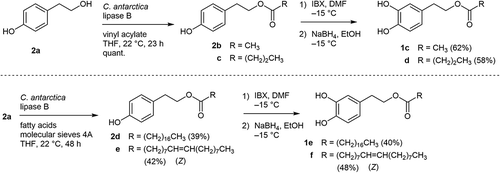
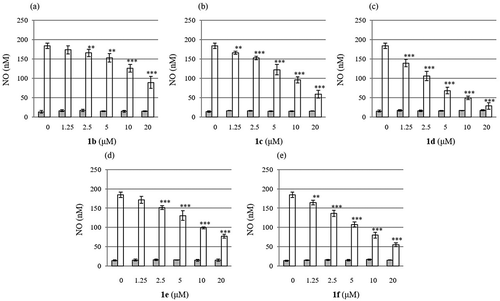
Figure 1. Suppression effect of 1b - f on the NO production stimulated by LPS in RAW264.7 cells. Shaded (left) bars and open (right) bars represent concentration of NO without (control experiments) or with LPS, respectively. Values are given as the mean ± S.D. from four independent experiments. Multiple group comparisons were made using one- or two-way analysis of variance (ANOVA) followed by Tukey’s test. *P < 0.05; **P < 0.01; ***P < 0.001 significantly different from the control group stimulated with LPS. For detail, see experimental section.